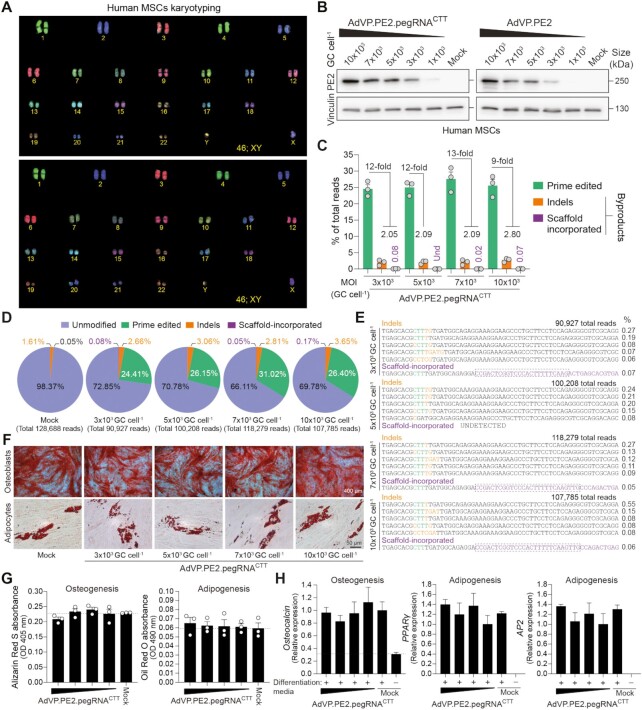
Figure 2.
Efficient prime editing in primary human mesenchymal stem cells through all-in-one AdVP delivery. (A) Karyotyping of hMSCs. COBRA-FISH analysis was used for confirming the normal diploid status (46;XY) of primary hMSCs. (B) Analyses of PE2 expression in primary hMSCs. hMSCs were transduced with AdVP.PE2.pegRNACTT or AdVP.PE2 at the indicated MOI. At 2 days post-transduction, PE2 expression was assessed by western blotting. Cas9- and vinculin-specific antibodies detected target and loading control proteins, respectively. (C) Relationship between prime edited alleles and byproduct variants in AdVP.PE2.pegRNACTT-transduced hMSCs. hMSCs were transduced with the indicated AdVPs at different MOI. At 3 days post-transduction, prime editing frequencies and unwarranted byproducts (i.e. indels and scaffold-derived insertions), were determined through CRISPResso2 analysis. Byproducts consist of small insertions and deletions (indels; orange bars) plus insertions derived from reverse transcription into the pegRNA scaffold (violet bars). Graph presents mean ± s.e.m. of three biological replicates; Und, undetected. (D) Characterization of prime editing in hMSCs. Pie chart parsing the frequencies of unmodified and modified alleles resulting from a transduction experiment in hMSCs. (E) Characterization of prime editing byproducts in hMSCs. Sequences and frequencies of the most frequent alleles bearing indels and pegRNA scaffold-derived insertions from a transduction experiment in hMSCs are presented. (F) Differentiation of prime-edited hMSCs. Differentiation capacity of mock- and vector-transduced hMSCs was established after their exposure to defined culture conditions. Osteoblasts and adipocytes were identified by Alizarin Red S and Oil Red O staining, respectively. (G) Quantification of osteogenic and adipogenic differentiation through Alizarin Red S and Oil Red O colorimetry, respectively. (H) Quantification of osteogenic and adipogenic differentiation via RT-qPCR targeting the indicated lineage-specific marker transcripts. Data are plotted as mean ± s.e.m. of three technical replicates. In all hMSCs transduction experiments MOIs ranged from 3 × 10³ through 10 × 103 genome copies per cell (GC cell–1).

