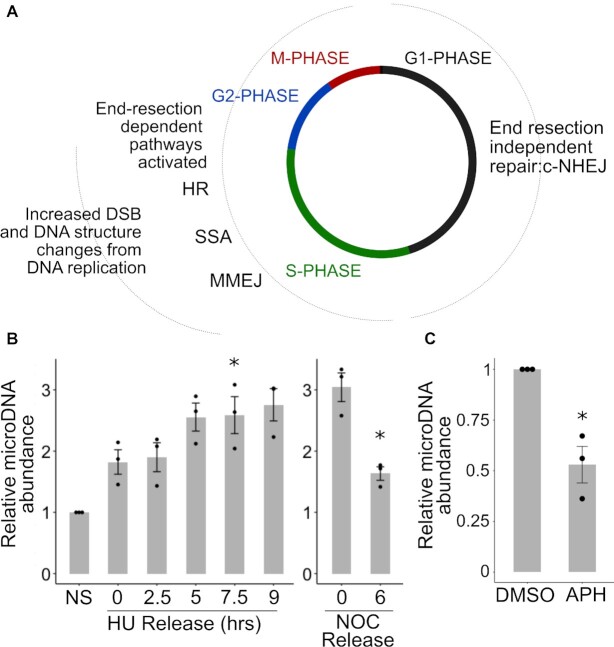
Figure 5.
MicroDNA formation is increased in S-phase, G2-phase, and M-phase of the cell cycle. (A) End-resection-independent pathway of repair is active in G1, while end-resection (and homology) dependent repair is more active in S and G2. (B) Left: microDNA levels in S-phase, Right: MicroDNA levels as cells pass through M-phase to G1. P-values <0.05 in a one-sample t-test, corrected for multiple hypothesis testing for the left panel, are indicated with a (*). (C) MicroDNA levels after the addition of 3 uM aphidicolin (APH). P-value <0.05 in a one-sample t-test is indicated with a (*). Mean ± S.E. shown

