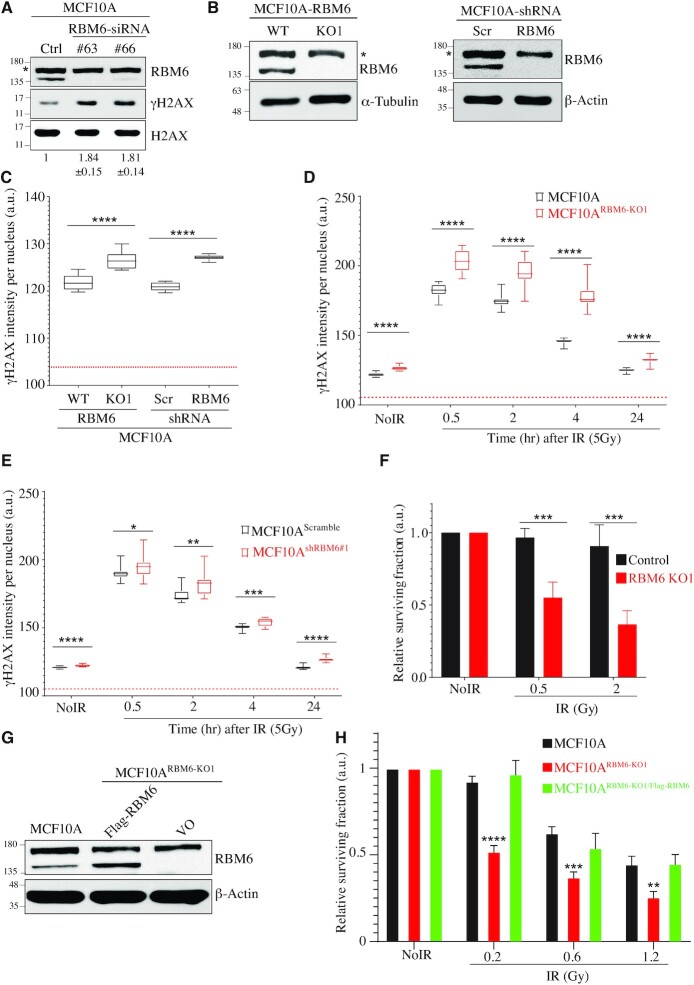
Figure 1.
RBM6 depletion leads to elevated levels of γH2AX and confers sensitivity to ionizing radiation. (A) Western blot shows γH2AX levels in MCF10A cells transfected either with control or RBM6 siRNAs. H2AX was used as a loading control. Band intensities of γH2AX were normalized to the intensities of their respective H2AX bands and the mean ratio ± SD (n = 3) is shown at the bottom of the blot. Two-tailed t-test: P-value(si#63) = 0.0004; P-value(si#66) = 0.0007. (B) Left: western blot for RBM6 to validate the generation of RBM6 knockout in MCF10A cells. α-tubulin was used as a loading control. Right: western blot analysis shows protein levels of RBM6 in MCF10A cells expressing either scramble shRNA or shRNA against RBM6. β-actin was used as a loading control. (C) RBM6-deficient cells exhibit elevated levels of γH2AX regardless of DNA damage. Control and MCF10ARBM6-KO1 and MCF10AshRBM6#1 cells were fixed and stained for γH2AX. High-content screening microscope (IN Cell Analyzer 2000; GE Healthcare) was used for automatic image acquisition. Data are presented as min to max box plot (n = ∼5000 cells per condition; unpaired t test across three replicates: *P< 0.01, **P < 0.001, ***P < 0.0001, ****P < 0.00001). Box plots represent γH2AX intensity per nucleus and red dotted line represents background fluorescent signal. (D, E) MCF10AWT and MCF10ARBM6-KO1 (D), and MCF10Ascramble and MCF10AshRBM6#1 (E) were exposed to IR (5 Gy) and fixed at the indicated timepoints after IR treatment. NoIR, no treatment. Image acquisition and analysis was performed as described in (C). (F) IR sensitizes RBM6-MCF10A deficient cells. MCF10AWT and MCF10A RBM6-KO1 were subjected to short-term growth delay assay. Cells were treated with increasing doses of irradiation and incubated for 48 h. Cell viability was determined using CellTiter 96® proliferation assay and normalized to untreated cells. Data are presented as mean ± SD (n = 3, two-way ANOVA; *P< 0.01, **P < 0.001, ***P < 0.0001, ****P < 0.00001). (G) Western blot analysis for RBM6 protein levels in MCF10AWT and MCF10ARBM6-KO1 cells ectopically expressing either RBM6 or an empty vector. β-Actin was used as a loading control. (H) Control and RBM6-KO1 cells expressing either RBM6 or empty vector were exposed to increasing dosage of IR and subjected to colony formation assay. Fourteen days post IR exposure, colonies were stained using crystal violet and counted. The number of colonies of IR-exposed cells was normalized to untreated controls. Data presented as mean ± SD (n = 3, two-way ANOVA; *P< 0.01, **P < 0.001, ***P < 0.0001, ****P < 0.00001). All experiments were performed in triplicates. * indicates unspecific band. The positions of molecular weight markers are indicated to the left of all western blots.

