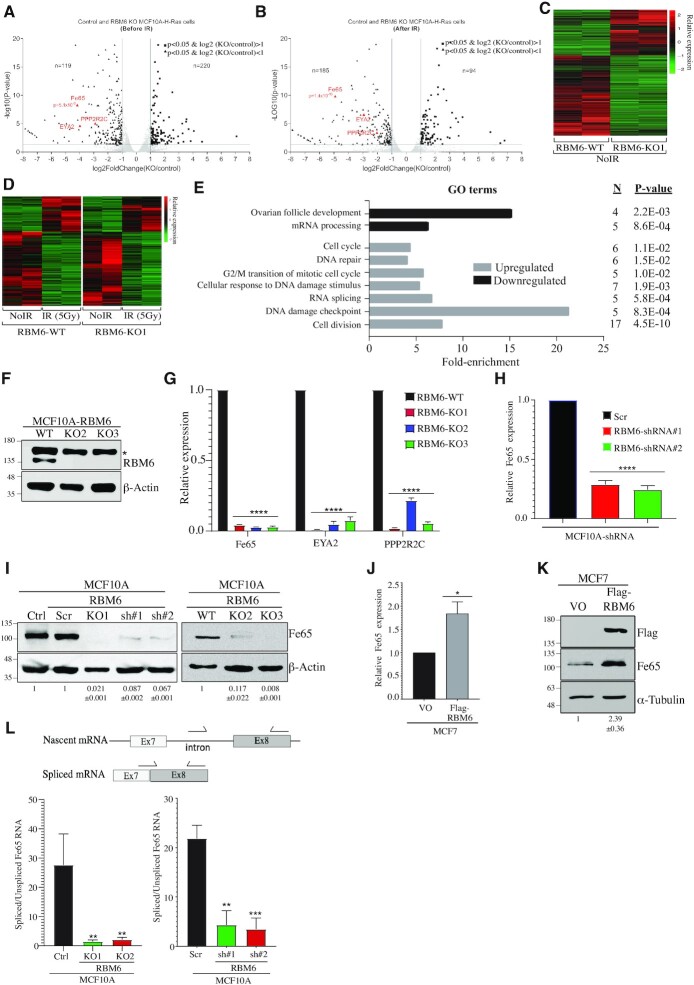
Figure 3.
Transcriptome analysis identifies Fe65 as a target gene of RBM6. (A, B) Volcano plots showing the differentially expressed genes between control and RBM6-knockout (KO1) MCF10A cells before (A) and after 12hr exposure to IR (5Gy) (B). DDR genes downregulated in RBM6 KO1 cells are highlighted in red. (C) Heatmap summarizing the differentially expressed genes in RBM6-knockout cells compared to control cells without IR treatment. The relative expression of genes with |log2(KO/control) > 1| and P< 0.05 is presented in each row for control and RBM6-knockout cells. (D) Heatmap summarizing IR-induced differentially expressed genes compared to untreated cells in control (left) and RBM6 knockout (right) MCF10A cells. Each row represents the relative expression of genes with |log2(+IR/–IR) > 1| and P< 0.05 in both control (left) and RBM6-knockout (right) cells. (E) Gene ontology analysis of genes from (D) that show differential response to IR in RBM6-knockout cells compared to control cells (F) Western blot analysis validating RBM6 knockout in two additional MCF10A clones. β-Actin was used as a loading marker. * indicates unspecific band. (G) RT-qPCR analysis showing the relative expression of Fe65, EYA2, and PPP2R2C in three different MCF10A RBM6 knockout clones compared to control MCF10A cells. Gene expression was normalized to the levels of GAPDH transcript. (H) RT-qPCR analysis showing the relative expression of Fe65 in MCF10A cells depleted of RBM6 using two different shRNA sequences. Gene expression was normalized to the levels of GAPDH transcript. (I) Western blot analysis using Fe65 antibody shows that RBM6 knockout or knockdown led to a severe reduction in Fe65 protein level. β-Actin was used as a loading marker. Band intensities of Fe65 from three independent experiments were normalized to the intensities of their respective β-actin bands and the mean normalized ratio ± SD is shown at the bottom of the blot. Two-tailed t-test: P-value < 0.0001. (J) RT-qPCR analysis showing the relative expression of Fe65 in MCF7 cells complemented with Flag-RBM6. Gene expression was normalized to the levels of GAPDH transcript. (K) Western blot analysis shows that complementing MCF7 cells with Flag-RBM6 led to an increase in Fe65 protein level. α-Tubulin was used as a loading marker. Band intensities of Fe65 from three independent experiments were normalized to the intensities of their respective α-Tubulin bands and the mean normalized ratio ± SD is shown at the bottom of the blot. Two-tailed t-test: P-value = 0.003. (L) Schematic diagram showing the location of qPCR primers (arrows) used to detect either nascent or spliced Fe65 transcript (Top). RT-qPCR analysis using primers to detect nascent (unspliced) and spliced Fe65 transcript. Shown is the ratio between the relative expression of spliced and unspliced Fe65 transcript in MCF10A RBM6-KO1 cells (left) or MCF10A cells depleted of RBM6 using two different shRNA sequences (right). Gene expression was normalized to the levels of GAPDH transcript. *P< 0.01, **P < 0.001, ***P < 0.0001, ****P < 0.00001. All RT-qPCR Data are presented as mean ± SD of three independent experiments.

