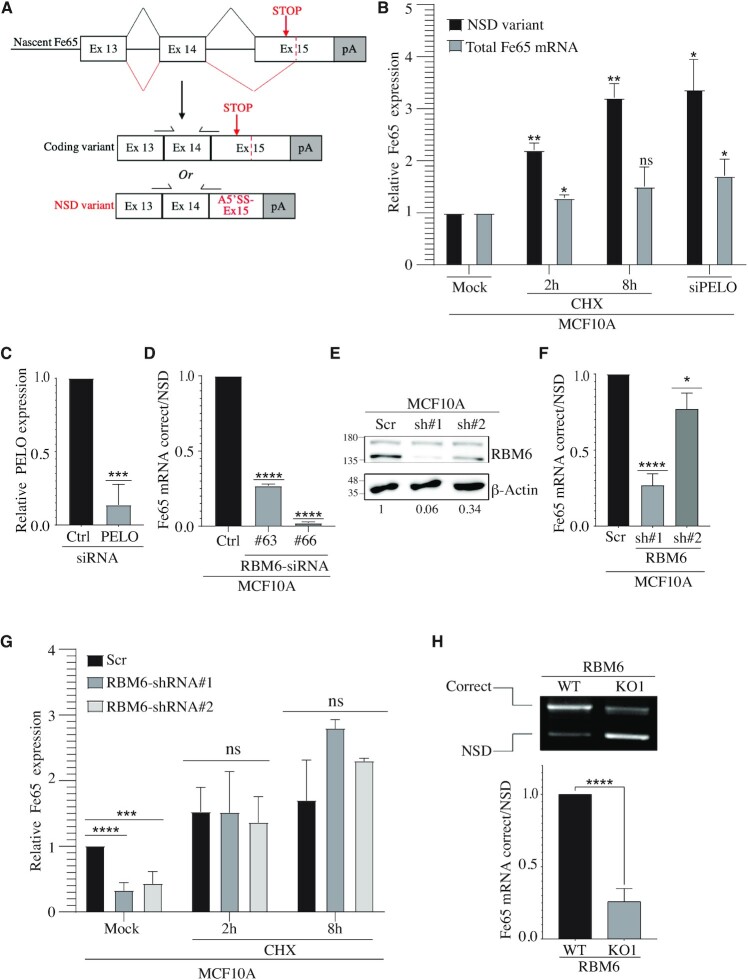
Figure 4.
Fe65 harbors an alternatively spliced variant targeted for nonstop-decay (NSD). (A) Schematic illustration of the alternative splicing event that results in the correct Fe65 coding variant or the NSD variant. (B) Cyclohexamide (CHX) treatment increases the levels of Fe65 NSD variant. MCF10A cells were left untreated or treated with 30 ug/ml CHX for 2 or 8 h. RNA was extracted from the cells and total Fe65 mRNA levels (spliced Fe65 mRNA detected by primers from Figure 3L) or NSD variant (specific primers detecting Fe65 NSD mRNA variant as shown in (A)) were measured by real-time PCR. PELO gene was depleted by siRNA and used as positive control. Results shown are typical of three independent experiments. (C) Real time PCR analysis showing the relative reduction in PELO mRNA levels following siRNA transfection. (D) RBM6 depletion increases the production of Fe65 NSD variant compared to the correct variant. MCF10A cells were transfected with two siRNAs against RBM6. Cells were harvested and RNA was extracted followed by real-time RT-qPCR analysis. Graph shows the relative expression of the correct variant/NSD variant. Data are presented as mean ± SD of three independent experiments. (E) Western blot analysis shows protein levels of RBM6 in MCF10A cells expressing either scramble shRNA or shRNAs against RBM6. β-Actin was used as a loading control. Band intensities of RBM6 were normalized to the intensities of their respective β-actin bands and the normalized ratio is shown at the bottom of the blot. (F) As in (D) except of using MCF10A cells stably infected with lentiviral vectors expressing either scramble or RBM6 shRNAs. (G) CHX treatment in RBM6-depleted cells restored the levels of Fe65 to similar levels as the control cells. MCF10A cells stably infected with lentiviral vectors expressing either scramble or RBM6 shRNAs were left untreated or treated with 30ug/ml cycloheximide (CHX) for 2 or 8 h. RNA was extracted and real-time RT-qPCR analysis was performed using primers to detect total levels of Fe65. Data presented are mean of three independent experiments ± SD. (H) Control and RBM6-KO1 MCF10A cells were treated with 30ug/ml CHX for 8 h to stabilize the Fe65 NSD transcript. RNA was extracted and subjected to reverse transcription followed by co-amplification of the correct and NSD transcripts using the same primer pair. PCR products were then analyzed by gel electrophoresis (top). Band intensities of the correct and NSD amplified products from three independent experiments were quantified and the normalized ratio is presented (bottom). *P< 0.01, **P < 0.001, ***P < 0.0001, ****P < 0.00001. The positions of molecular weight markers are indicated to the left of all western blots.

