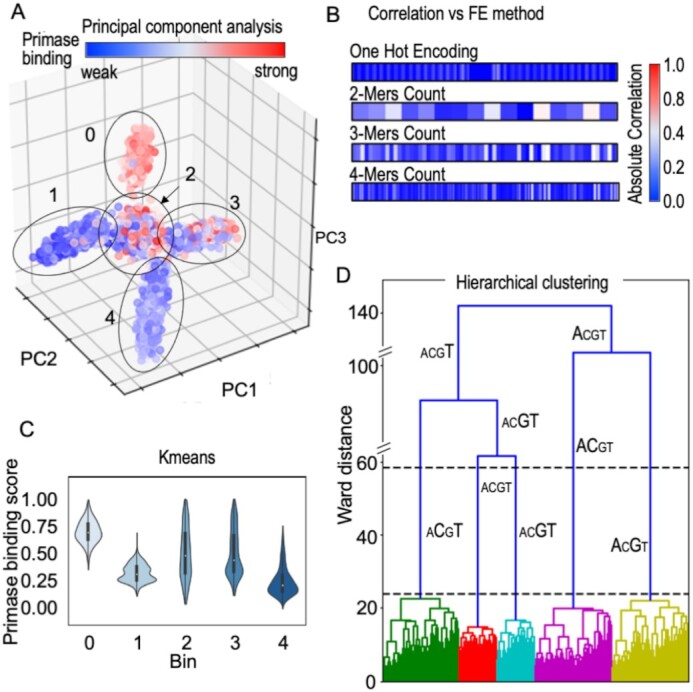
Figure 3.

Inference from DNA sequences without labeled responses for T7 primase binding (unsupervised learning). (A) Dimensionality reduction algorithm PCA tri-plot used to visualize the data by selecting the top three principal components. Assignment of the binding scores (labels) to each data point shows an uneven distribution across two clusters (2, 3) and a homogeneous distribution in three clusters (0, for strong binding to T7 primase, and 1 and 4 for weak binding). (B) Correlation between the primase binding score and feature extraction (FE) using different methods: OHE, 2-mer, 3-mer and 4-mer counts. K-mers were used as descriptors for the PCA analysis. (C) Kmeans clustering on one-hot encoded DNA sequences. Clustering was performed by measuring pairwise distances of DNA sequences from the centroid of each cluster. Violin plots representing the distribution of the binding scores assigned to each data point in the clusters are shown. Three clusters show evenly distributed scores (0, 1, 4) and two show a less homogeneous score distribution (2, 3). Each cluster is represented by a ‘mean word’ (centroid): (0) GTTTTGTTTTGTTTTTGTCGTGTGGTTGTGGTGGTA; (1) CTTTTTTTCTTTTTTCGTCCTTTTTTTTTTTCCCCA; (2) GAAGAAAATCCATAGGGTCAACCGGGTTATGTTAAA; (3) CCACAAAAAAAAAAAAGTCCAACCCACAAAACCCC A; (4) GGAAAGGAGAGAAAAAGTCAAAAAAGAAAGAAAGAA. (D) Hierarchical clustering. The x-axis shows DNA sequences emerging into clusters, and the y-axis shows the induced Ward distance of each stage. Letter sizes indicate the letter's frequency in each cluster. The maximal Ward distance gap is indicated between the dashed black lines. The figures were created using the Python package Seaborn and Matplotlib.
