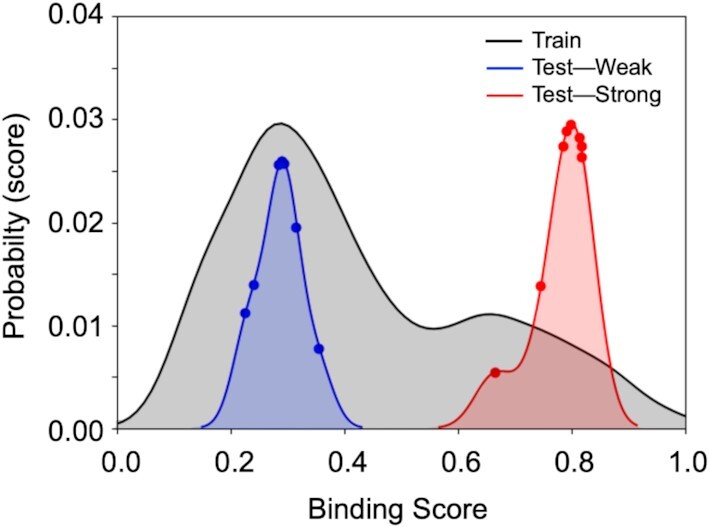
Figure 4.

Results for linear regression with L1 regularization (Lasso). After cleaning, the training set contained 3150 instances (DNA sequences), whereas the test set contained 16 instances. Prediction of scores by using the regression model was performed on 16 DNA sequences with known scores, eight of which showed weak binding to T7 primase (blue graph) and eight showed strong binding to T7 primase (red graph). In accordance with the training-set double distribution (black graph), the predicted binding of the two test groups are distributed in weak and strong binding scores areas, respectively. Although the probability of finding DNA sequences with strong binding to primase is low, the model accurately predicted all DNA sequences that belong to the strong binding group. DNA sequences and their empirical and predicted scores are presented in Supplementary Table S2.
