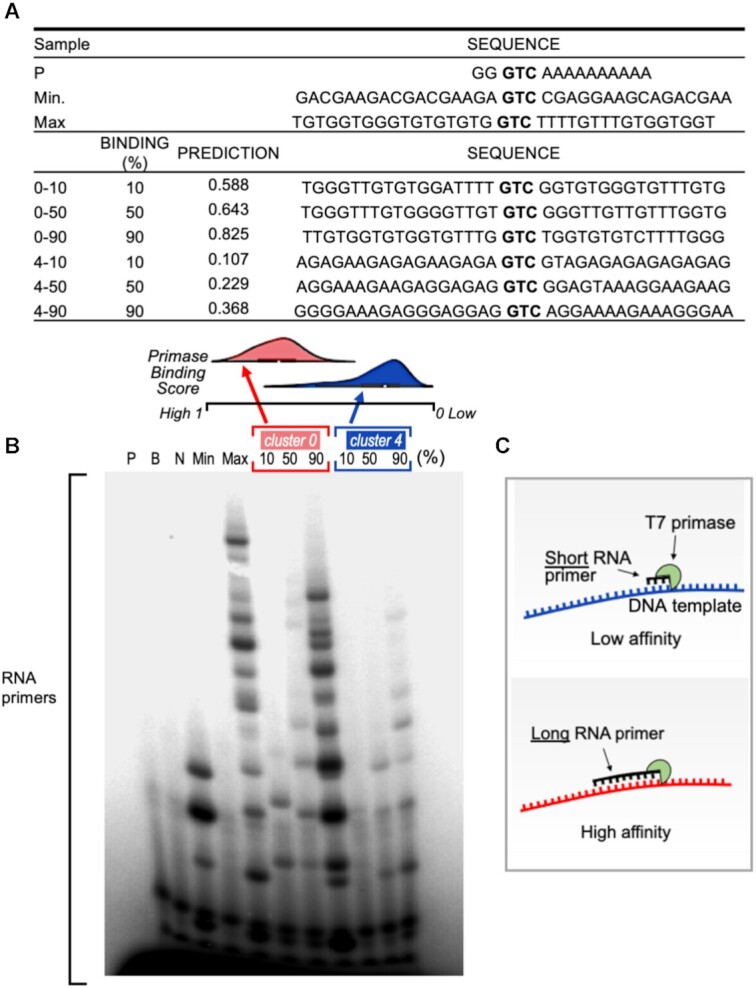
Figure 5.

RNA primer synthesis catalyzed by the T7 primase on computer generated GTC-containing DNA templates. (A) Table summarizes the DNA template sequences used for the biochemical validation and their corresponded values. Three DNA sequences from each of the Kmeans clusters #0 and #4 that predicted the 10th, 50th and 90th percentile binding scores were selected in each cluster. (B) Top: Distribution of binding values for the two clusters. Note that cluster #0 shows stronger primase binding values, on average, than cluster #4. Bottom: Oligoribonucleotide synthesis by T7 primase. The standard reaction mixture contained oligonucleotides with the primase recognition sequence, a control oligonucleotide 5′-GGGTCA10-3′, and [γ-32P]ATP, CTP, GTP and UTP. After incubation, the radioactive products were analyzed by electrophoresis on a 25% polyacrylamide gel containing 7 M urea, and visualized using autoradiography. The pattern of primase activity remains identical when using the full-length helicase-primase (gene 4 protein, gp4) of bacteriophage T7 (Supplementary Figure S5). (C) illustration of the effect of primase-DNA binding affinity on the size of RNA primers.
