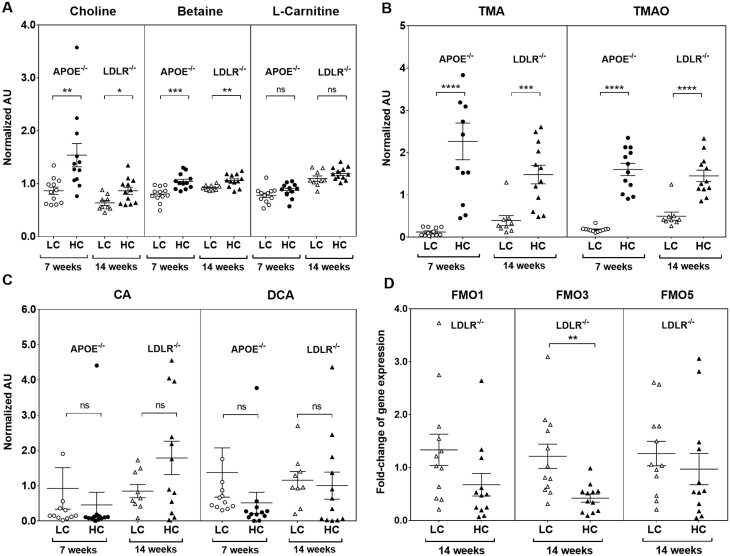
Figure 1.
Plasma metabolites and hepatic FMOs expression in low choline (LC) vs. high choline (HC)-fed mice. Normalized abundance of (A) choline, betaine, and carnitine; (B) TMA and TMAO; (C) CA and DCA in ApoE−/− and Ldlr−/− mice. Data are expressed as mean ± SEM and are representative of two independent experiments [n = 12 mice/diet for ApoE−/−; n = 9 mice/low choline, n = 12 mice/high choline diet (Ldlr−/−)]. (D) Relative liver mRNA of FMO1, FMO3, and FMO5 from Ldlr−/− mice (n = 12/diet). Data are from a single representative experiment. All data were analysed using Student’s t-test. *P < 0.05, **P < 0.01, ***P < 0.001, ****P < 0.0001. CA, cholic acid; DCA, deoxycholic acid; FMO, flavin-containing monooxygenase; TMA, trimethylamine; TMAO, trimethylamine-N-oxide.

