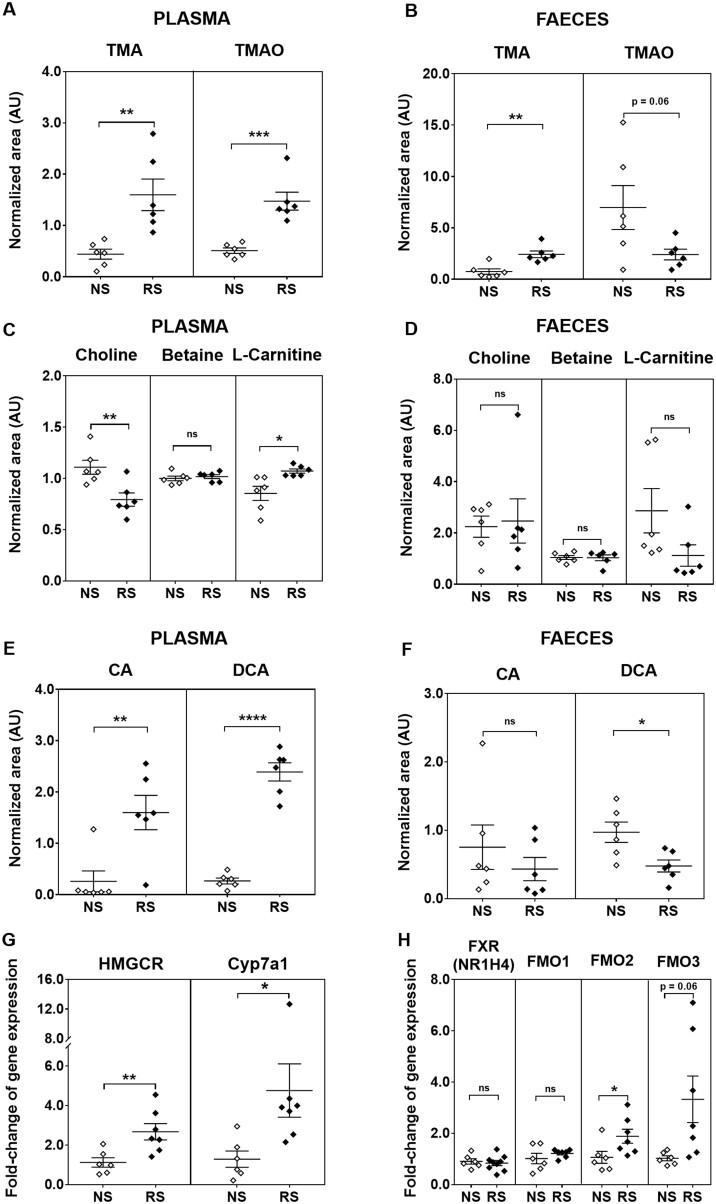
Figure 2.
Plasma and faecal metabolites, and hepatic gene expression in resistant starch (RS) vs. native starch (NS) mice. Normalized abundance of plasma and faecal levels of (A, B) TMA and TMAO; (C, D) choline, betaine, and carnitine; (E, F) CA and DCA. Data are shown as mean ± SEM and are representative of two independent experiments with n = 6/diet. Relative liver mRNA of (G) HMGCR and CYP7A1, (H) FXR, FMO1, FMO2, and FMO3 in the liver of NS- and RS-fed mice (mean ± SEM, data are from a single representative experiment with n = 6/NS diet, n = 7/RS diet). All data were analysed using Student’s t-test. *P < 0.05, **P < 0.01, ***P < 0.001, ****P < 0.0001. CYP7A1, cholesterol 7α-hydroxylase; FXR, farnesoid X receptor; HMGCR, 3-hydroxy-3-methylglutaryl-coenzyme A reductase.

