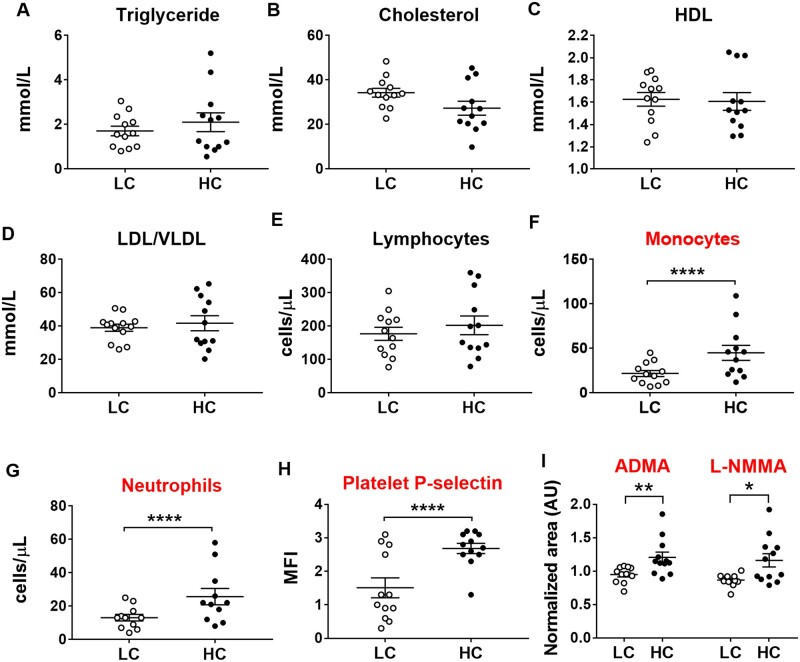
Figure 5.
Lipids, inflammatory cell count, platelet activation, and plasma levels of ADMA and L-NMMA in LC vs. HC. Data plots show (A) triglycerides, (B) total cholesterol, (C) HDL, (D) LDL, (E) circulating lymphocytes, (F) monocytes, (G) neutrophils (E–G: Sysmex data), (H) platelet activation (as indicated by surface expression of platelet P-selectin in flow cytometry) in ApoE−/−mice (n = 9–13 per group). Data are presented as median and interquartile range and statistical analysis was performed using non-parametric Mann–Whitney tests. (I) Plasma ADMA and L-NMMA. mean ± SEM of n = 11–12 per group. Metabolomic data were analysed using Student’s t-test and data shown are representative of a single experiment. *P < 0.05, **P < 0.01, ****P < 0.0001. ADMA, asymmetric dimethylarginine; HDL, high-density lipoprotein; LDL, low-density lipoprotein; L-NMMA, NG-monomethyl-l-arginine.

