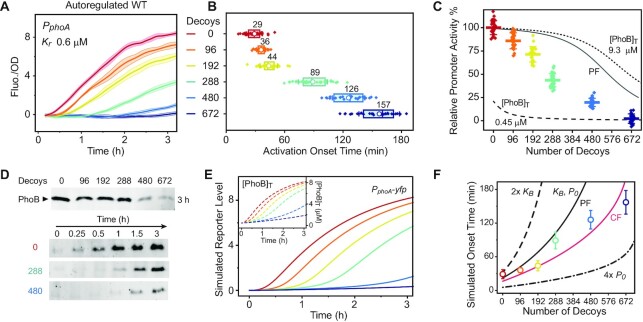
Figure 3.
Effects of decoy sites on the output level and timing of transcription in the autoregulated WT. (A–C) Effects of decoys on PphoA-yfp activities in the WT RU2079 strain. Decoys decreased reporter fluorescence (A), delayed response as shown in activation onset times (B) and reduced the relative promoter activities (C). Data from individual wells are shown by diamond symbols and the averages are shown in circles in (B) and horizontal bars in (C). Lines are modeled curves: solid, positively autoregulated; dashed and dotted, constitutive PhoB expression at indicated concentrations. (D) Reduced and delayed PhoB expression in the presence of decoys. Immunoblots were used to show total PhoB levels 3 h after activation (top) and PhoB expression kinetics (bottom). (E) Simulated decoy effects in the autoregulatory system. Both PphoA transcription levels and total PhoB concentrations (inset) are simulated for a system with a sole positive feedback. (F) Dependence of onset time on autoregulation parameters. Colored circles indicate the mean ± SD of experimentally measured onset times from (B). Simulated onset time for PphoA is defined as the time when [PhoBp]free reaches the binding affinity of PphoA, 0.6 μM. Black lines are simulated with a sole positive feedback (PF) with indicated autoregulation parameters and the red line is modeled with a coupled feedback (CF).

