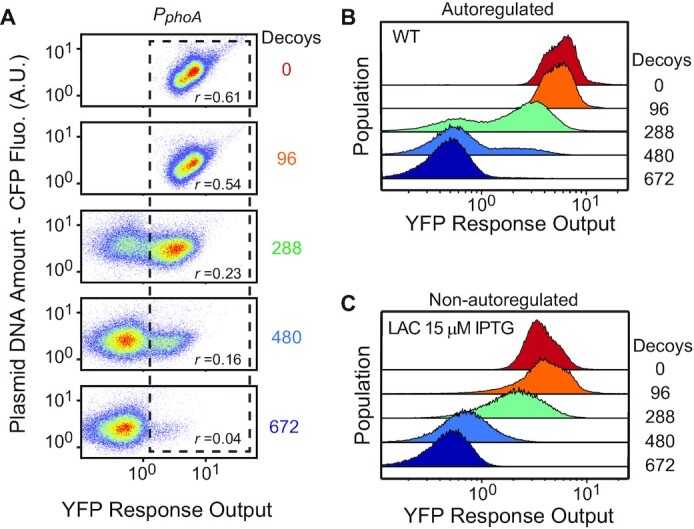
Figure 4.

Bimodal distribution of reporter fluorescence in the presence of decoy sites. (A) Flow cytometry analyses of RU2079 (PphoA-yfp) carrying different decoy plasmids. Every decoy plasmid contains a constitutively expressed cfp gene. The vertical axis shows CFP fluorescence that reflects plasmid copies while the horizontal axis shows the reporter YFP fluorescence. Dashed rectangles highlight the cell populations with activated YFP fluorescence, and correlations between CFP and YFP fluorescence for these activated populations are indicated by the Spearman correlation coefficient r. (B and C) Histograms of PphoA-yfp fluorescence for the autoregulated WT (RU2079) and non-autoregulated LAC (RU1988) strain.
