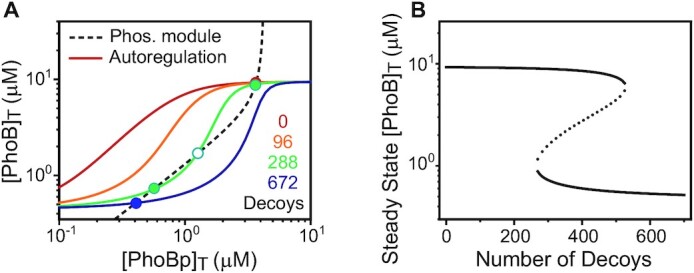
Figure 5.

Modeling of bistability caused by decoy competition. (A) Steady-state output in the autoregulated system. The relationship between [PhoB]T and [PhoBp]T can be described by both the phosphorylation module (dashed line) and autoregulation module (solid lines). Intersections of the two curves satisfy both modules, representing the steady-state solutions. Decoy sites lead to ultrasensitivity in autoregulation, causing multiple steady states. Filled circles represent stable steady states while the empty circle indicates the unstable steady state. (B) Effects of decoy sites on steady-state [PhoB]T. Two solid lines illustrate stable steady states with unstable states (dashed line) in the middle. All curves are simulated using a sole feedback model with parameter values in Supplementary Table S2 except for: Kdecoy = 0.125 μM, and KB = 0.5 μM.
