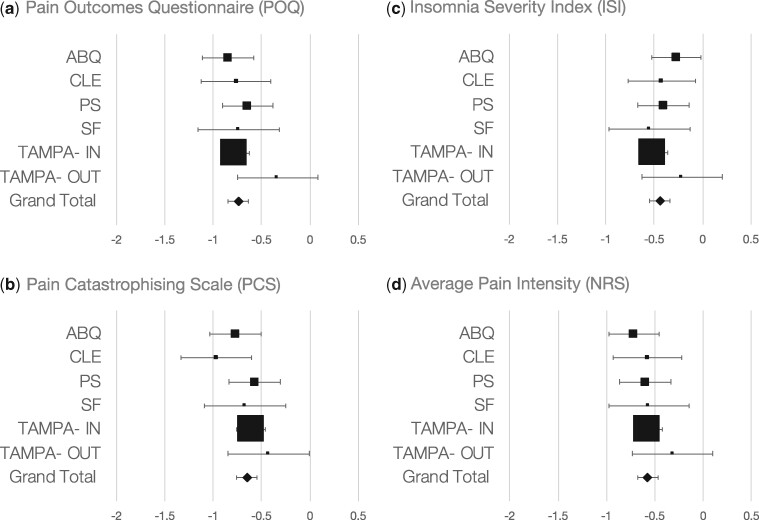
Figure 2.
Treatment effect mean differences in pain outcomes. Standardized Mean Difference (SMD) with 95% confidence intervals for Pain Outcome Questionnaire (POQ) (A), Pain Catastrophizing Scale (PCS) (B) Insomnia Severity Index (ISI) (C) and Average Pain Intensity (NRS) (D). Significant improvement was observed for all outcomes measures [Pain NRS: Hedges’g (SMD)= −0.58, 95% CI −0.69 to −0.48], P < 0.001, I2 = 0.0%), POQ: Hedges’g (SMD)= −0.74, 95% CI −0.8 to −0.63, P < 0.001, I2 = 2.6%, PCS: Hedges'g (SMD)= −0.65, 95% CI −0.75 to −0.54, P < 0.001, I2 = 8.5%, ISI: Hedges’g (SMD)= −0.44, 95% CI −0.54 to −0.33, P < 0.001, I2 = 0.0%]. There was no association between program duration and reported outcomes (P’s > 0.05).

