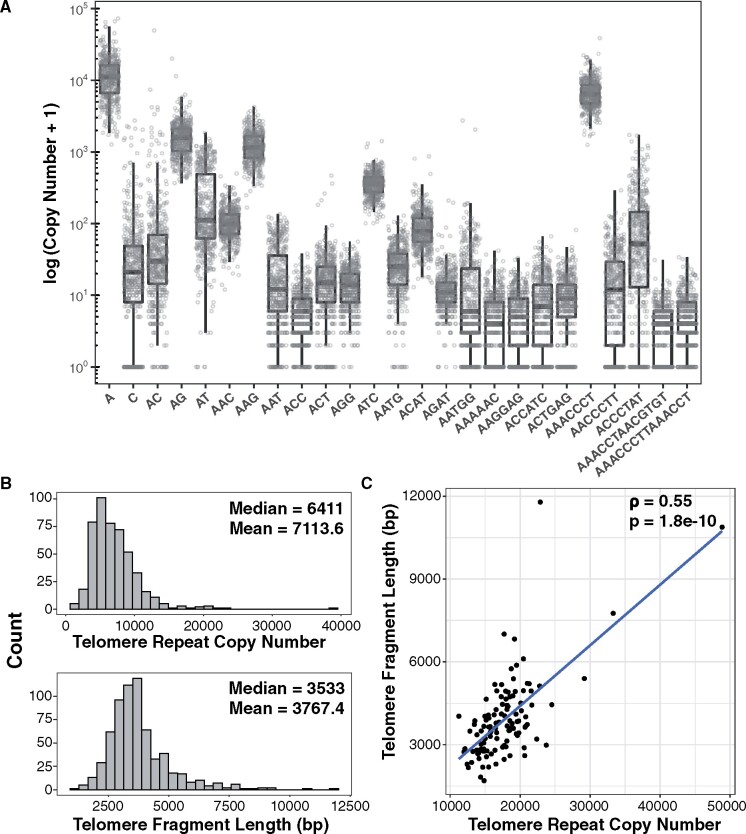
Figure 1.
Arabidopsis thaliana tandem repeat profile. (A) Top 25 most abundant k-mers from the AraThaKmer set. K-mers are ordered alphabetically, then by size. Whiskers in boxplot represent ± 1.5* interquartile range. (B) Distribution of estimates of telomere repeat copy numbers from the AraThaKmer set (above) and terminal fragment lengths from the AraThaTRF set (below). (C) Scatter plot of telomere lengths from the 112 accessions that were in common between the AraThaKmer and AraThaTRF sets. Spearman ρ and P-values are shown in the upper-right side.

