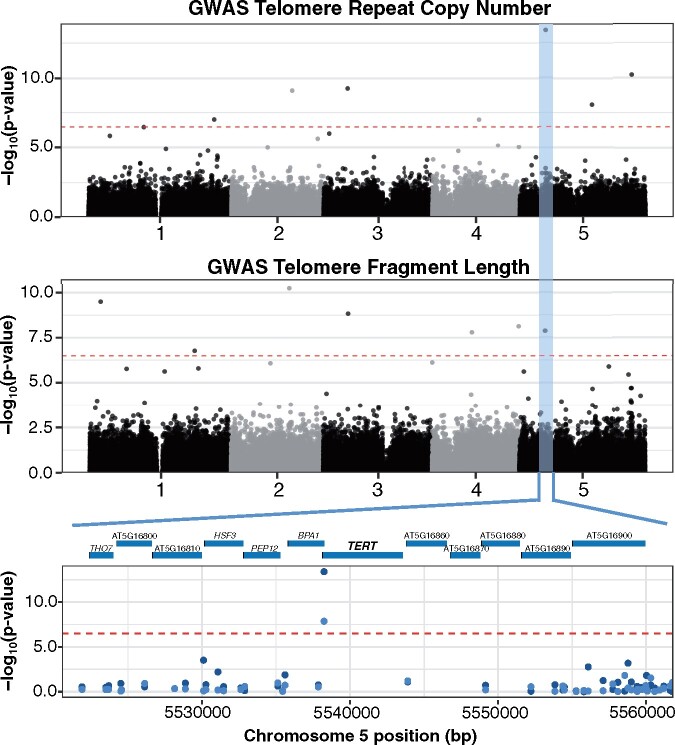
Figure 2.
GWAS of A. thaliana telomere length variation. Manhattan plot of the genome-wide P-values testing the association of telomere copy number of the AraThaKmer set (top) and terminal fragment length of the AraThaTRF set (middle) using the FarmCPU approach. Red dotted line indicates the Bonferroni-corrected significance threshold (α = 0.05). The GWAS-significant region common in both the AraThaKmer and AraThaTRF sets is highlighted in blue. Closeup of the region with the most significant GWAS SNP is shown at the bottom. Dark blue points are GWAS P-values from the AraThaKmer set, and light blue points are GWAS p-values from the AraThaTRF set.

