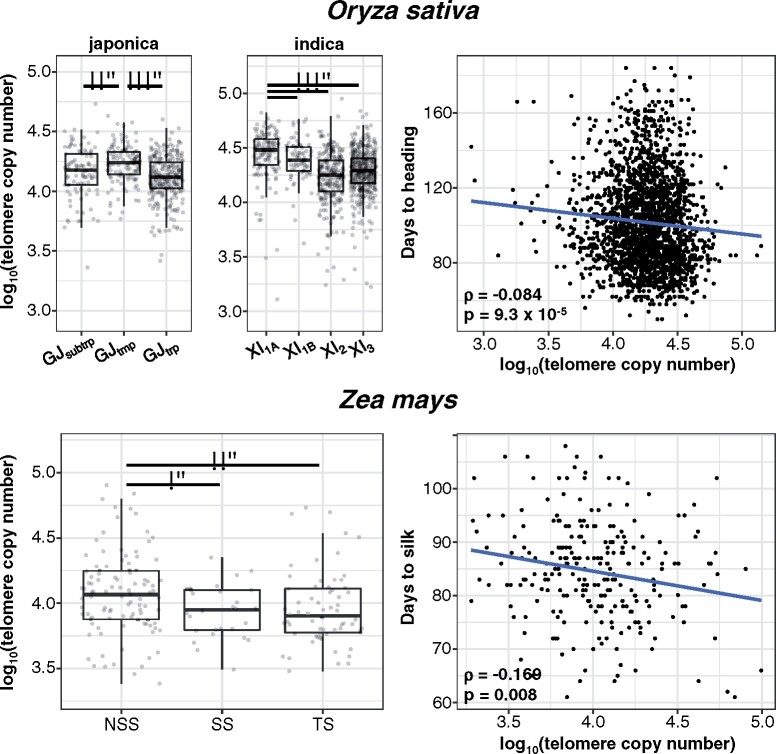
Figure 6.
Association between telomere length and flowering time in rice (O. sativa) and maize (Z. mays). Telomere copy numbers per subpopulation are shown on the left. *P < 0.05, **P < 0.01, and ***P < 0.001. Correlation between telomere copy number and flowering time is shown on the right. For maize, the days to silk measured in Aurora, NY in 2007 is shown. Spearman’s ρ and P-values are shown in the lower-left side of each plot. Whiskers represent ±1.5* interquartile range.

