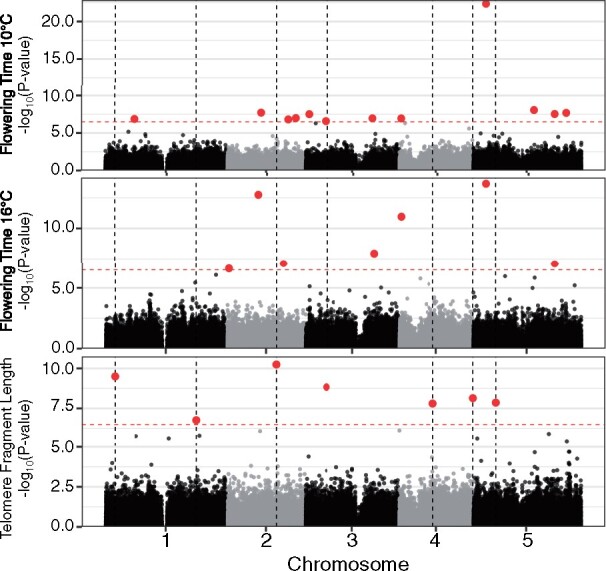
Figure 7.

Genetic architecture underlying flowering time and telomere variation. GWAS results using the AraThaTRF set for flowering time at 10°C (top), flowering time at 16°C (middle), and terminal fragment length (bottom). Red dotted line indicates the Bonferroni-corrected significance threshold (α = 0.05). Dotted vertical lines are positions of the GWAS-significant SNPs for telomere fragment length. Red points indicate GWAS-significant SNPs.
