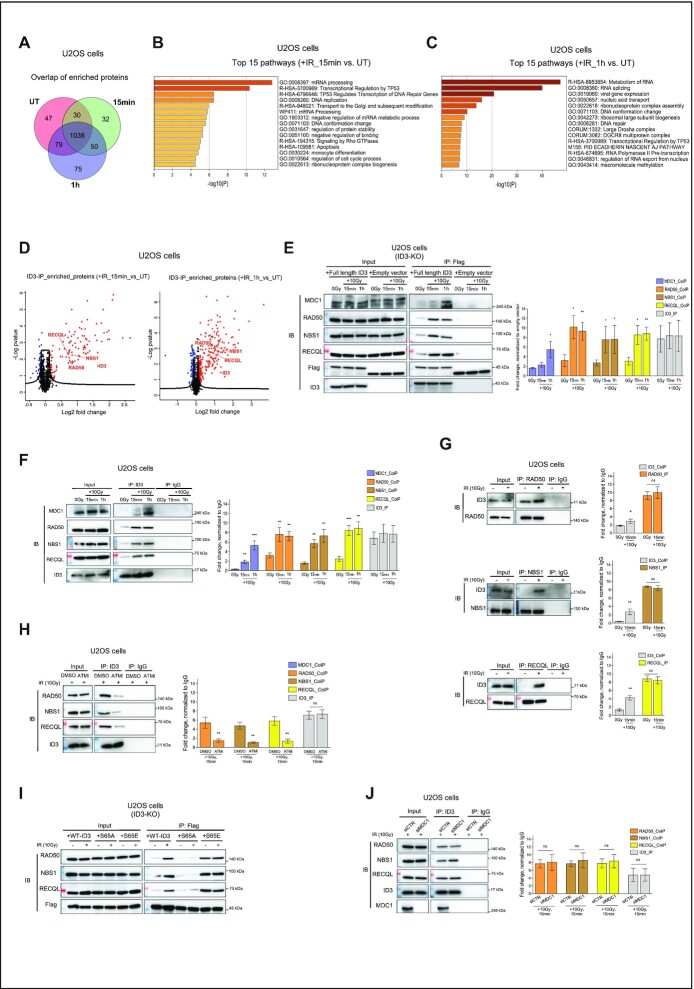
Figure 1.
ID3 interacts with DNA repair proteins after IR. ID3-KO cells expressing Flag-tagged ID3 were irradiated with 10 Gy and harvested at 15 or 60 min after irradiation. (A) Venn diagram showing the mass spectrometry-identified interaction peptides among unirradiated (UT) and irradiated samples after 15 and 60 min. (B) Pathway enrichment analysis using the interaction proteins 15 min after irradiation. Analysis was done using Metascape resources (Ref.# 71). (C) Pathway enrichment analysis using the interaction proteins 1h after irradiation. Analysis was done using Metascape resources (Ref.# 71). (D) Volcano plot showing identified ID3 interaction candidates, identified proteins are highlighted in red. Y-axis represents t-test statistics of log-10 LFQ intensities. (E) IP of Flag-ID3 using Flag-beads followed by Western blot to validate co-IP of the identified DNA repair proteins interacting with ID3 (Representative Western blot, left panel) and a bar plot for the quantification of three independent Western blots (right panel, mean ± SD). (F, G) Western blot to confirm interaction of endogenous ID3 to RAD50, NBS1 and RECQL (left panels) and bar plot showing the quantification of three independent Western blots (right panels, mean ± SD). (H) Western blot of the co-IP of RAD50, NBS1 and RECQL to ID3 after treatment either with DMSO or 10 μM ATMi prior to irradiation (representative Western blot, left panel) and a bar plot of the quantification of three independent Western blots (right panel, mean ± SD). (I) Western blot of the co-IP of RAD50, NBS1 and RECQL to WT-ID3, phospho-dead ID3 (S65A) and phospho-memic ID3 (S65E). (J) Western blot of the co-IP of RAD50, NBS1 and RECQL to endogenous ID3 upon knockdown of MDC1 prior to irradiation (representative Western blot, left panel) and a bar plot for the quantification of three independent Western blots (right panel, mean ± SD). Student's t test was used. Statistical significance is presented as: * P < 0.05, ** P< 0.01, ***P< 0.001, ****P < 0.0001, ns = not significant.

