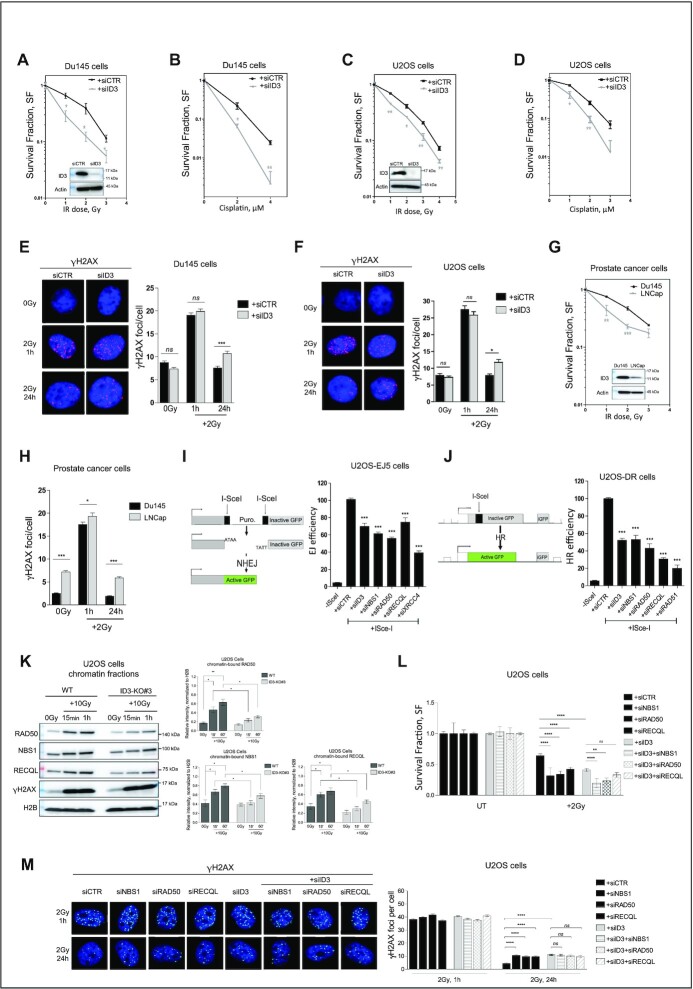
Figure 2.
ID3 is required for cell survival and DSB repair. (A–D) Clonogenic survival assay of Du145 and U2OS cells transfected either with control siRNA (siCTR) or a pool of four siRNAs targeting ID3 (siID3) and treated with the indicated dose of ionizing radiation or concentrations of cisplatin. n = 3 independent experiments;data are presented as mean ± SEM, one-way ANOVA with Bonferroni's multiple comparison test. (E, F) Representative micrographs and quantification of IR-induced γH2AX foci in Du145 and U2OS cells, ca. 500 cells were counted at indicated time points. n = 3 independent experiments; data are presented as mean ± SEM, one-way ANOVA with Bonferroni's multiple comparison test. (G) Clonogenic survival assay of prostate cancer cell lines with different ID3 expression levels treated with the indicated doses of ionizing radiation. n = 3 independent experiments; data are presented as mean ± SEM, One-Way ANOVA with Bonferroni's multiple comparison test. (H) Quantification of IR-induced γH2AX foci in prostate cancer cell lines with different ID3 expression levels treated with 2 Gy, ca. 500 cells were counted at the indicated time points. n = 3 independent experiments; data are presented as mean ± SEM, One-Way ANOVA with Bonferroni's multiple comparison test. (I, J) NHEJ efficiency measured in U2OS-EJ5 cells and HR efficiency measured in U2OS-DR cells using the indicated siRNAs, respectively. n = 3 independent experiments; data are presented as mean ± SD, one-way ANOVA withTukey's multiple comparison test. (K) Western blot of the chromatin-bound fractions of RAD50, NBS1 and RECQL in U2OS cells (Representative Western blot, left panel) and a bar plot of the quantification of three independent Western blots (right panel, mean ± SD). (L) Clonogenic survival assay of U2OS cells transfected with the indicated siRNAs and treated with 2Gy of ionizing radiation. n = 3 independent experiments; data are presented as mean ± SEM, one-way ANOVA with Bonferroni's multiple comparison test. (M) Representative Micrographs and quantification of IR-induced γH2AX foci in U2OS cells transfected the indicated siRNAs, ca. 500 cells are counted at indicated time points. n = 3 independent experiments; data are presented as mean ± SEM, one-way ANOVA with Bonferroni's multiple comparison test. Statistical significance is presented as: * P < 0.05, ** P < 0.01, *** P < 0.001, **** P < 0.0001, ns = not significant.

