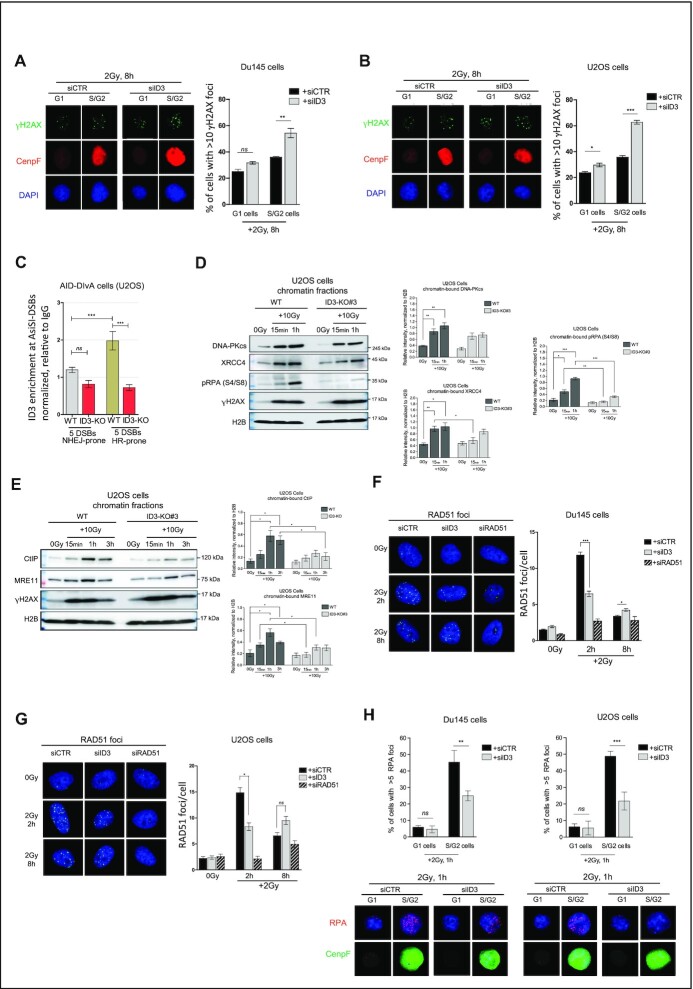
Figure 3.
ID3 loss impacts HR. (A, B) Representative micrographs and quantification of IR-induced γH2AX foci in Du145 and U2OS cells counted in G1 and S/G2 cells using the cell cycle marker CenpF. n = 3 independent experiments; data are presented as mean ± SD, one-way ANOVA withTukey's multiple comparison test. (C) Enrichment of ID3 at NHEJ-prone and HR-prone DSBs in AID-DIvA cells, measured by ChIP-qPCR. n = 3 independent experiments; data are presented as mean ± SEM,Student's t test. (D) Western blot of the chromatin-bound fractions of DNA-PKcs, XRCC4 and pRPA (S4/S8) (representative Western blot, left panel) and a bar plot of the quantification of three independent Western blots (right panel, mean ± SD), Student's t test was performed. (E) Western blot of the chromatin-bound fractions of CtIP and MRE11 (representative Western blot, left panel) and a bar plot of the quantification of three independent Western blots (right panel, mean ± SD), Student's t test was performed. (F, G) Representative micrographs and quantification of IR-induced RAD51 foci in Du145 and U2OS cells, respectively, ca. 500 cells were counted at indicated time points. n = 3 independent experiments; data are presented as mean ± SEM, Student's t test was performed. (H) Representative micrographs and quantification of IR-induced RAD51 foci in Du145 and U2OS cells, respectively, ca. 500 cells were counted at indicated time points. n = 3 independent experiments; data are presented as mean ± SEM, Student's t test was performed. Statistical significance is presented as: * P< 0.05, ** P < 0.01, *** P < 0.001, **** P < 0.0001, ns = not significant.

