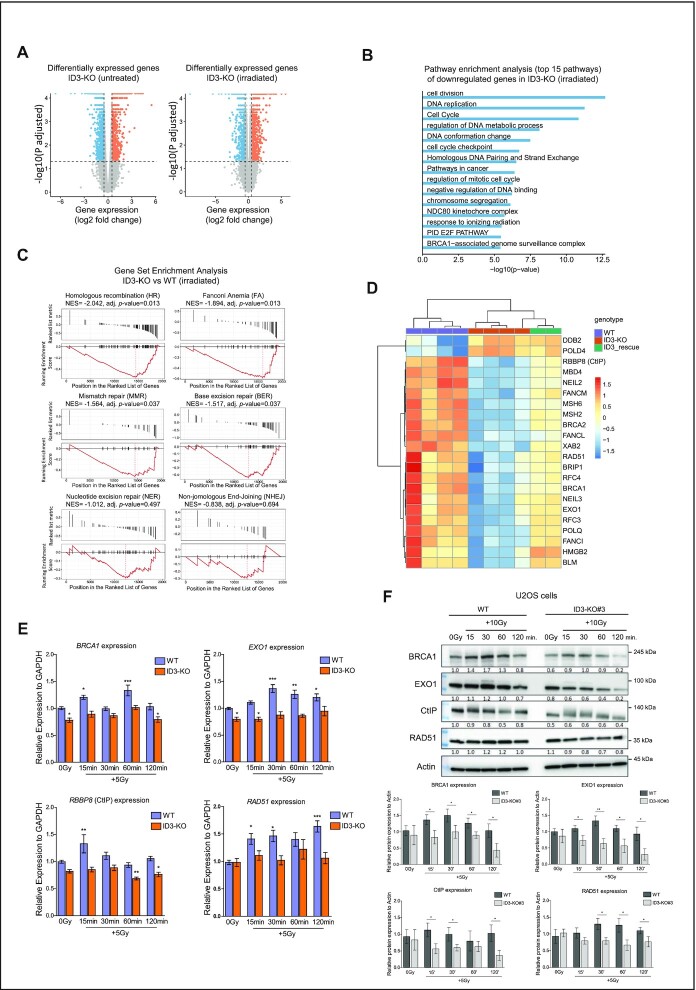
Figure 4.
ID3 regulates expression of genes involved in DNA repair in response to IR. (A) Volcano plots showing differentially expressed genes in ID3-KO cells; untreated (0 Gy, left) and irradiated cells (5 Gy, right). Measured by RNA-seq (n = 4). (B) Gene ontology enrichment analysis of the significantly downregulated genes in irradiated ID3-KO cells. (C) Barcode plot showing gene set enrichment analysis of DNA repair pathways of differentially expressed repair genes in irradiated ID3-KO cells. NES = normalized enrichment score. (D) Heat map showing differentially expressed DNA repair genes with a log2 fold change < -0.5 for downregulated genes and > 0.5 for upregulated genes in irradiated WT, ID3-KO and ID3-rescue cells. n = 4, 4 and 2 for WT, KO and rescue cells, respectively. (E) RT-qPCR expression analysis of BRCA1, EXO1, RBBP8 (CtIP) and RAD51 genes in WT and ID3-KO with IR treatment (5 Gy) at indicated time points, n = 5, data presented as mean ± SEM, one-way ANOVA with Dunnett's multiple comparison test to compare all to the WT untreated. (F) Western blot showing expression of BRCA1, EXO1, RBBP8 (CtIP), and RAD51 proteins in WT and ID3-KO with IR treatment at indicated time points (representative Western blot, upper panel) and a bar plot of the quantification of three independent Western blots (lower panel, mean ± SD), Student's t test was performed. Statistical significance is presented as: * P< 0.05, ** P < 0.01, *** P < 0.001, **** P < 0.0001, ns = not significant.

