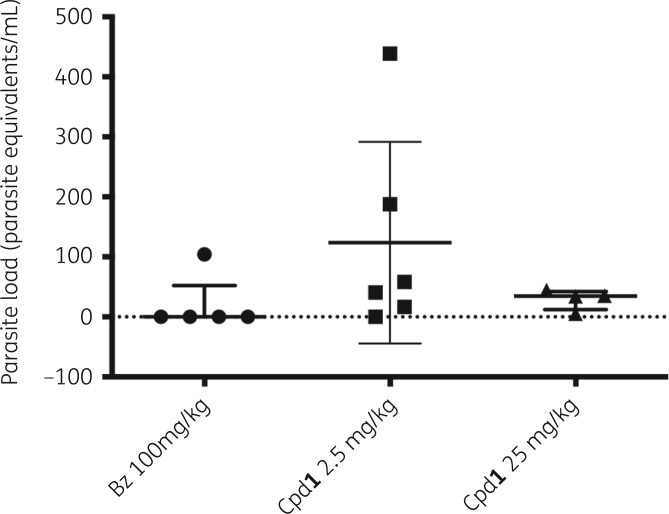
Figure 5.
Blood qPCR analysis of surviving Swiss male mice infected with T. cruzi (Y strain) and orally treated with Cpd1 (25 and 2.5 mg/kg, q12h) and benznidazole (Bz) (100 mg/kg, q24h). Parasite load is referred as number of parasite equivalents per mL. Each symbol on the scatter dot plots represents an individual value. Bars represent the median values and whiskers represent the IQR. Statistical analysis was performed by one-way multiple comparison ANOVA Tukey’s test between the experimental groups (P < 0.05, 95% CI), all displaying no significant (ns) difference: 0.31 < P < 0.43.

