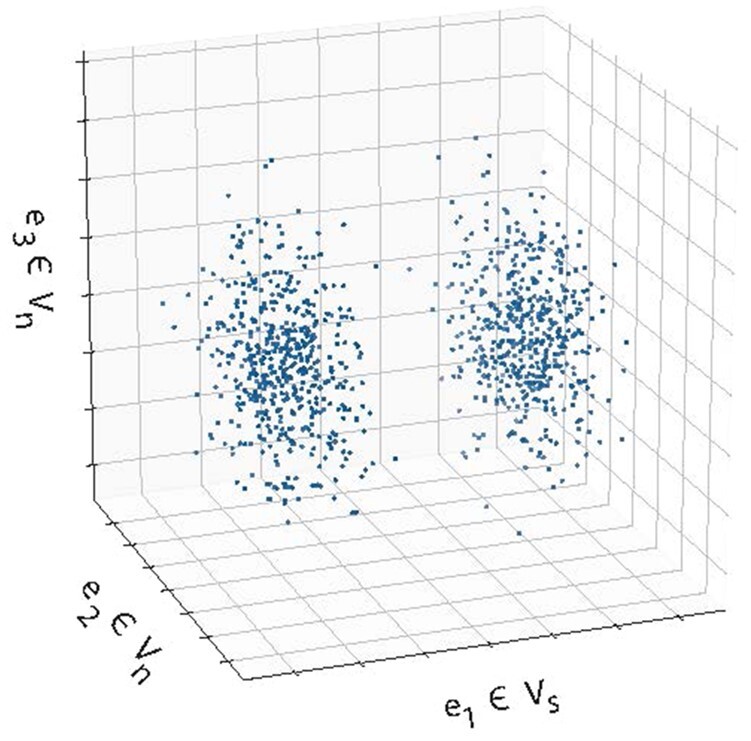
Fig. 1.

Gaussian data with unit variance shown along three axes. The marginal distribution of contains signature of distinct clusters, with a bimodal marginal distribution where each mode corresponds to a cluster. Here, the clusters are linearly separable along the e1 axis. The marginal distributions of and are unimodal, and do not linearly separate groups of data points. Here, we designate as part of Vs as it contains multimodal signal, and do not. The three axes shown here represent a subspace of a D > 3-dimensional distribution
