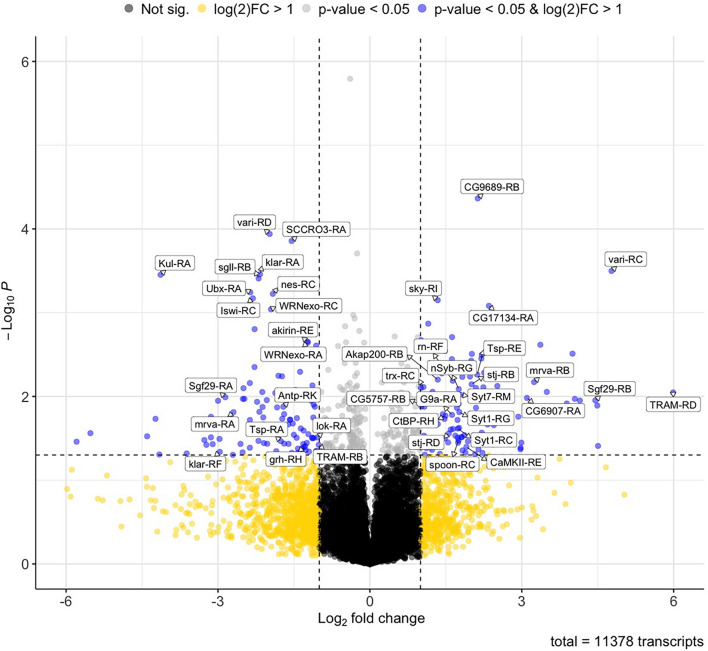
FIGURE 1.
Volcano plot of differentially expressed transcripts induced by chronic alcohol exposure. Volcano plots showing fold change of differential transcript expression [log2 fold change] compared to the inverse of statistical significance [−log10 (P-value)]. Points in black or yellow are transcripts with no significant changes in expression (P > 0.05). Points in gray and blue correspond to transcripts with significant changes in expression (P < 0.05). Points in blue correspond to transcripts with significant changes in expression (P < 0.05) and that display a fold change higher than 2-fold (log2 fold change > 1). Names of genes encoding representative transcripts are labeled in the plot.

