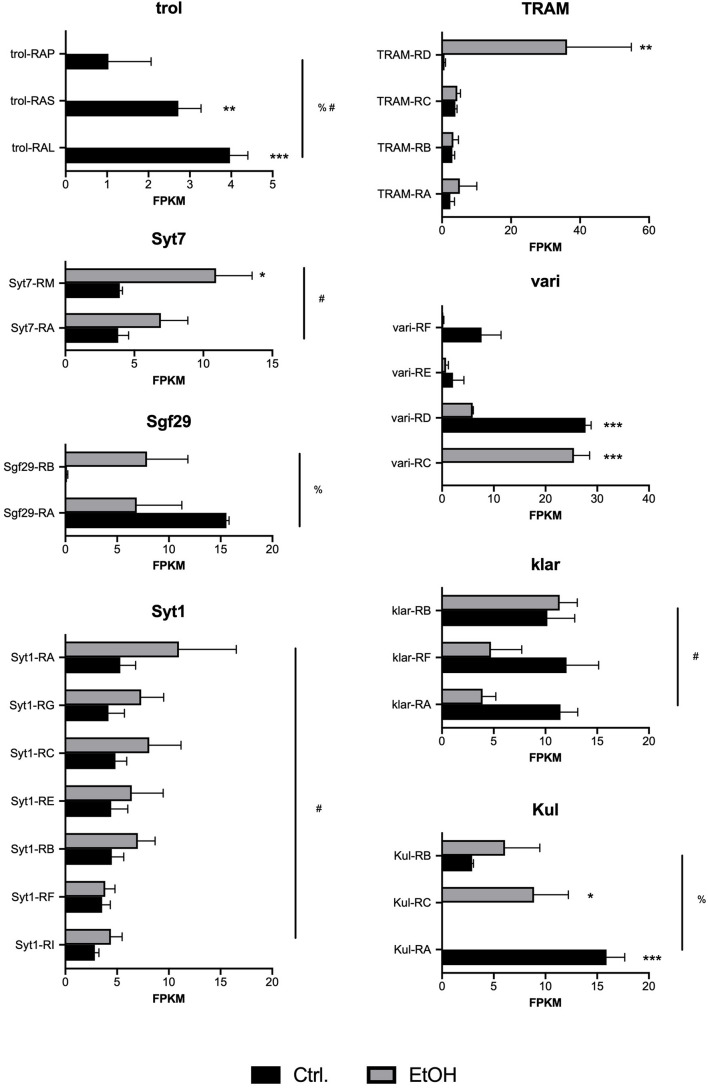
FIGURE 2.
Transcript-specific expression induced by chronic alcohol exposure. Shown are FPKM counts in control (Ctrl, black bars) and alcohol treated (EtOH, gray bars) larvae for independent transcriptional isoforms of eight selected genes: trol, Syt7, Sgf29, Syt1, TRAM, vari, klar, and Kul. Significant differences were detected by Two-way ANOVA followed by Sidak’s multiple comparisons test. Asterisks denote significant differences between control and alcohol treated samples (*p < 0.05, **p < 0.01, ***p < 0.001). The pound sign (#) denotes a significant effect of treatment on all transcripts within the gene (p < 0.05). The percent (%) sign denotes a significant interaction between treatment and transcript identity (p < 0.05).

