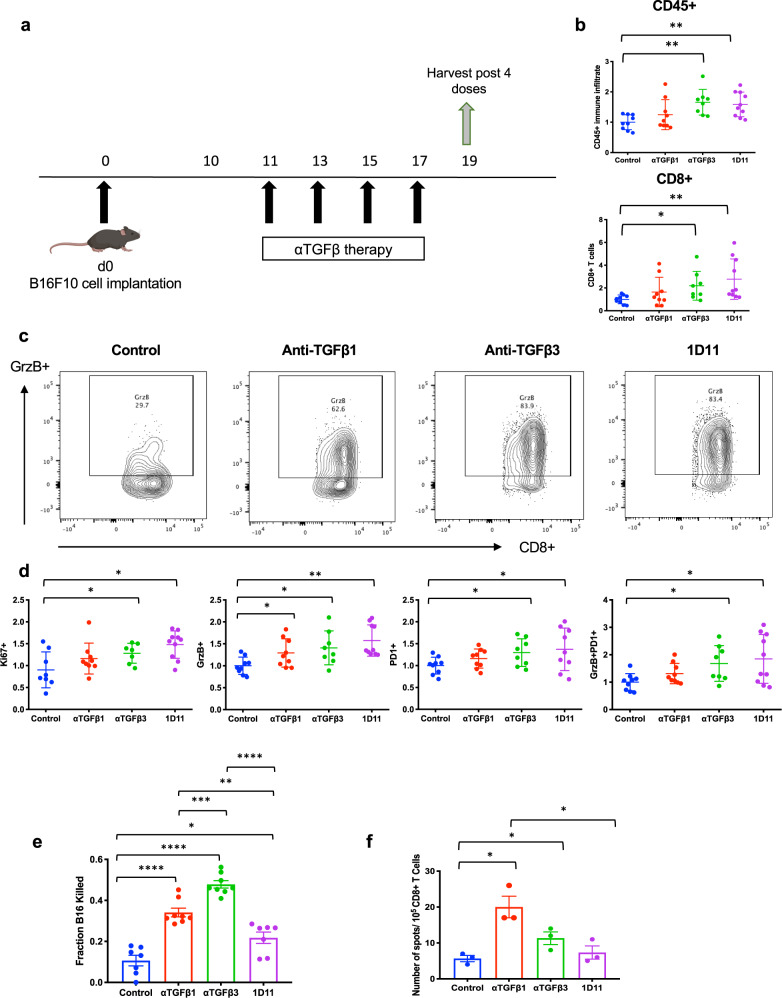
Fig. 4. Isoform-specific TGFβ inhibition induces CD8+ T cell activation.
a Experimental schema used to analyze B16 tumor immune infiltrates. Tumors of control and treated animals (n = 5 mice/group) were harvested following four doses of anti-TGFβ therapy and underwent flow cytometric processing and analysis as described in “Methods”. b Plots showing changes in CD45+ tumor-infiltrating immune cells (top panel) and CD8+ tumor-infiltrating lymphocytes (TILs) (bottom panel) post four doses of anti-TGFβ treatment. Data represent pooled values from two independent experiments (n = 5 mice/group) that were normalized to the control and are displayed as fold change compared to the control ± SD initially gated on CD45+ immune cells and subgated on CD8+ T cells. c Representative flow cytometry plots showing Granzyme B+ (GrzB) expression in CD8+ TILs, which were gated from CD45+ live cells. d Activation of CD8+ TILs from control and anti-TGFβ treated groups showing changes in Ki67+, GrzB+, PD-1+ and GrzB+PD-1+CD8+ T cells post 4 doses of therapy. Data represent pooled values from two independent experiments normalized to the control (n = 5 mice/group) and is displayed as fold change compared to the control ± SD gated on CD8+ T cells. e CD8+ T cells were purified from the spleens of control and treated animals according to the experimental setup shown in a. For the killing assay, CD8+ T cells were plated with B16 cells at a ratio of 50:1 effector: target for 48 h. The remaining B16 cells were measured using a clonogenic assay 1 week later. Data are representative of pooled values from two independent experiments (n = 5 mice/group) normalized to the highest count. B16 killing was normalized to the highest count and the fraction of killing is displayed as ± SEM. f For the IFN- EliSpot, CD8+ T cells were plated with irradiated B16 cells at a ratio of 2:1 for 24 h. IFN- production was quantified using the ImmunoSpot platform. Data are representative of two independent experiments (n = 3 mice/group) and is plotted as ±SEM. For all panels only statistically significant differences among untreated and treated groups is shown. *p < 0.05; **p < 0.001; ***p < 0.0005; ****p < 0.0001.

