Figure 1.
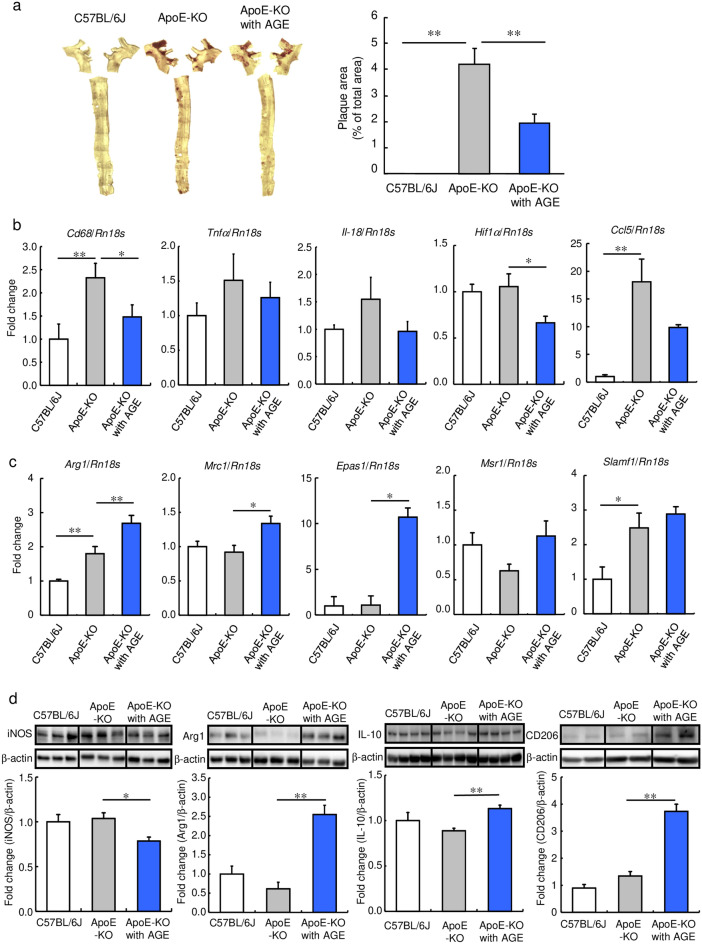
Effect of AGE on lipid deposition and M1/M2-macrophage marker expression in vascular tissue and spleen of ApoE-KO mice. C57BL/6 J (Control) and ApoE-KO mice were fed a diet with or without 3% AGE for 17 weeks. (a) Oil Red O staining of a thoracic aorta. Bar graphs show the percentage of the Oil Red O-positive area in the aorta. (b, c) The relative mRNA levels of (b) M1 macrophage marker genes (Cd68, Tnfα, Il-18, Hif1α, and Ccl5) and (c) M2 macrophage marker genes (Arg1, Mrc1, Epas1, Msr1, and Slamf1) in aorta. (d) The relative protein levels of iNOS, Arg1, IL-10, and CD206 in splenic lymphocytes. Data were quantified by analyzing each band intensity relative to a β-actin band after immunoblotting. The full-length blots are shown in Supplemental Figs. S8 and S9. Data are shown as mean + SEM (n = 5–8/group). Statistical differences were determined by Bonferroni’s multiple comparison test (*p < 0.05 and **p < 0.01).

