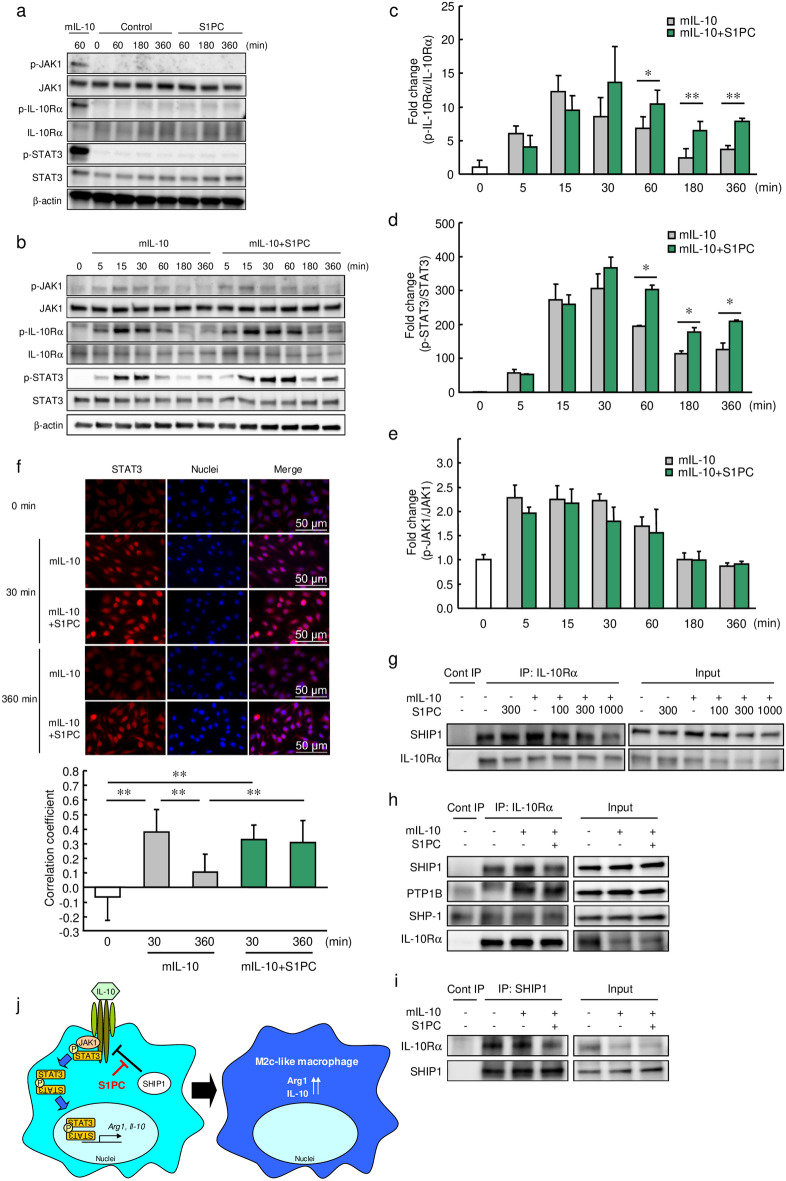
Figure 4.
Effect of S1PC on the IL-10 signaling pathway. (a) M-CSF-induced BMDMs were treated with mIL-10 (2 ng/mL), PBS (Control) or S1PC (300 µM) for 60–360 min. The cell lysates were analyzed using immunoblotting with the indicated antibodies. The full-length blots are shown in Supplemental Fig. S10. (b–e) M-CSF-induced BMDMs were treated with S1PC (300 µM) in the presence of mIL-10 (2 ng/mL) for 5–360 min. The relative protein levels of (c) phospho-IL-10Rα, (d) phospho-STAT3, and (e) phospho-JAK1 was quantitated using immunoblotting. The full-length blots are shown in Supplemental Figs. S11 and S12. (f) M-CSF-induced BMDMs were immunostained with anti-STAT3 antibody (red) and hoechst 33342 (blue) for nuclear visualization after stimulation with mIL-10 (2 ng/mL) in the presence of S1PC (300 µM) for 30 and 360 min. Scale bar, 50 µm. Bar graphs show the correlation coefficients between nuclei and STAT3-positive regions. (g) J774A.1 cells were treated with S1PC (100–1000 µM) in the presence or absence of mIL-10 (10 ng/mL) for 1 h. Cell lysates were immunoprecipitated with anti-IL-10Rα antibody and analyzed using immunoblotting with the indicated antibodies. The full-length blots are shown in Supplemental Fig. S13. (h, i) J774A.1 cells were treated with S1PC (300 µM) in the presence of mIL-10 (10 ng/mL) for 1 h. Cell lysates were immunoprecipitated with (h) anti-IL-10Rα or (i) anti-SHIP1 antibodies and analyzed using immunoblotting with the indicated antibodies. The full-length blots are shown in Supplemental Figs. S14 and S15. (j) The proposed mechanism of macrophage polarization promoted by S1PC under M2c polarizing conditions. Data are shown as mean + SD. Data are representative of three independent experiments. Statistical differences were determined using (f) Bonferroni’s multiple comparison test or (c–e) Student’s t-test (*p < 0.05 and **p < 0.01).

