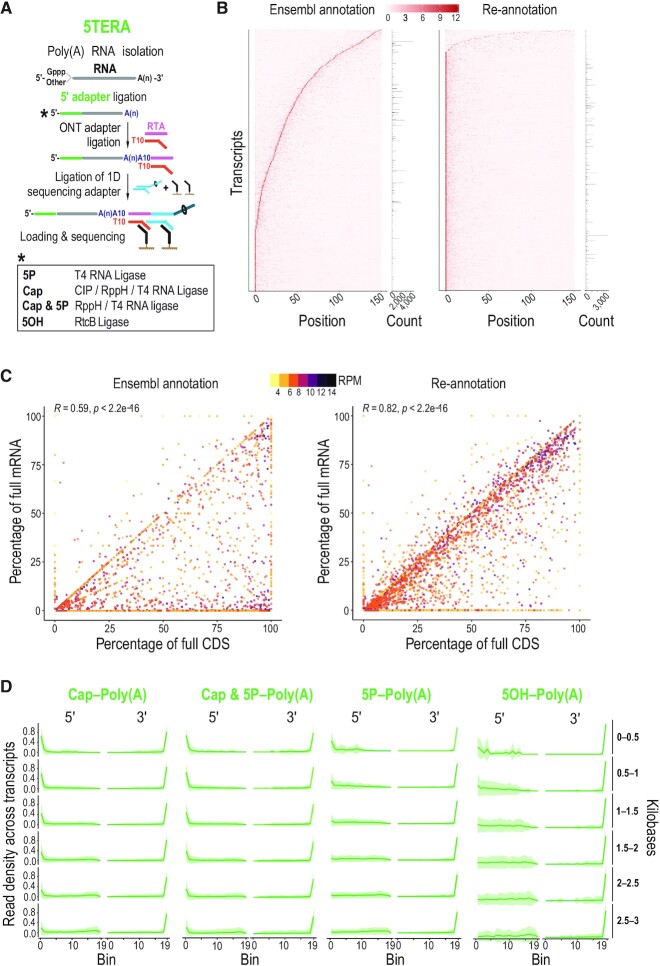
Figure 1.
True end-to-end sequencing of single native polyadenylated RNA molecules with 5′ adapter ligation (5TERA). (A) Method schematic. Enzymatic treatments to identify indicated 5′ ends by adapter ligation are shown in box. ONT, Oxford Nanopore Technologies; RTA, reverse transcriptase adapter; CIP, Calf Intestinal Phosphatase; RppH, RNA 5′ Pyrophosphohydrolase; 5P, 5′ monophosphate; 5OH, 5′ hydroxyl, Gppp, 5′ cap; A(n), poly(A) tail; T, thymidine. (B) Heatmap of read density of the 5′ ends close to the annotated transcription start site based on Ensembl annotation (left) and on re-annotated transcripts (right) from Cap-Poly(A) library. Only molecules with 5′ adapter are used for the analysis. Y-axis corresponds to individual transcripts. Positions up to 150 nucleotides from transcription start site are shown on the x-axis. Z-scores are calculated per row and scale is depicted on top. Number of reads corresponding to each transcript is shown on the right. Only top 30% most expressed transcripts are shown. (C) Correlation of the completeness of CDS and mRNA with expression levels based on Ensembl annotation (left) and on re-annotated transcripts (right) from Cap-Poly(A) library. Only molecules with 5′ adapter are used for the analysis. Each point represents an individual transcript. Color represents transcript expression level, calculated as the log2 of reads per million (RPM). Pearson's correlation (R) and associated P-value are shown on top. CDS, Coding Sequence; mRNA, messenger RNA. (D) Distribution of molecule ends per transcript length from indicated 5TERA libraries on HeLa re-annotated transcripts. Distribution of reads is calculated for individual transcripts and then averaged for visualizing (green line). Shaded area (green) represents the standard deviation. Only molecules with 5′ adapter are used for the analysis. Meta-coordinates are defined by splitting each transcript into 20 equal bins. Transcript lengths, grouped by 500 nucleotides are shown on the right.

