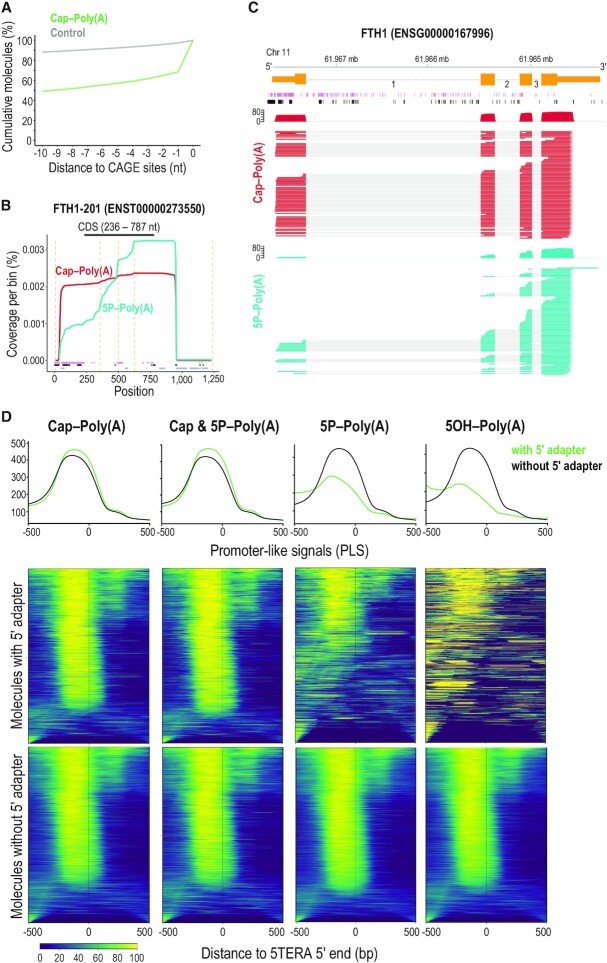
Figure 2.
Relation of 5′ ends of native RNA molecules to transcription start sites and to active promoters. (A) Distance of capped 5′ adapter-ligated ends of polyadenylated RNAs identified with 5TERA (green line), and control (grey), to CAGE sites. Control was created by generating 100 000 random positions within transcripts detected in at least one library. Only positions with a direct overlap or downstream to CAGE sites were considered. Y-axis represents the cumulative percentage of overlaps within the visualized range section. CAGE, Cap Analysis of Gene Expression. (B) Coverage of Ferritin Heavy Chain transcript 1 (FTH1-201) from indicated libraries and positions of Native Elongating Transcript–Cap Analysis of Gene Expression (NET-CAGE) signals (purple), CAGE signals (black), and Alternative Polyadenylation (APA) sites (blue). Only molecules with 5′ adapter are analyzed. Dashed orange lines indicate exon-exon boundaries. All visualized positions are binned by 5 nucleotides. CDS, Coding Sequence. (C) Visualization of coverage and alignment of sequenced molecules to FTH1 gene from FTH1-201 transcript, from indicated 5TERA libraries. Genomic coordinates, Ensembl transcript (orange) with numbered introns, NET-CAGE signals (purple), and CAGE signals (black) are shown on top. Only molecules with 5′ adapter are analyzed. Mb, megabase. (D) Summary plots and heatmaps of ENCODE-annotated, promoter-like signals (PLS) around 5′ ends of mRNAs identified by 5TERA. The summary profile plot (top panel) indicates enrichment around the 5′ ends (position 0) for reads with adapter (green) and without adapter (black). Heatmaps show distribution of PLS for each 5′ end separately. Each line in the heatmap represents a single 5′ end/read. Reads with adapter (middle panels) and reads without adapter (bottom panels) are visualized separately. Scale is shown at the bottom; low signal, dark blue; strong signal, yellow). All 5′ ends were collapsed prior to analysis. 500 base pair (bp) region upstream and downstream from 5TERA 5′ ends is visualized.

