Figure 3.
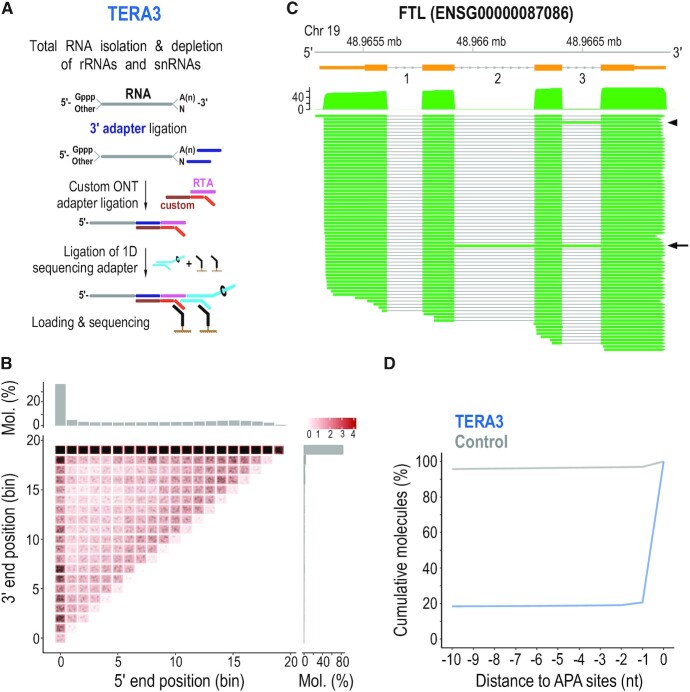
Identification of native 3′ ends of single RNA molecules by direct sequencing with 3′ adapter ligation (TERA3). (A) Method schematic. rRNAs, ribosomal RNAs; snRNAs, small nuclear RNAs; Gppp, 5′ cap; A(n), poly(A) tail; custom RTA, reverse transcriptase adapter with custom bottom sequence. (B) Heatmap of molecule ends from a TERA3 library on transcript meta-coordinates. Each dot (black) corresponds to a single molecule and its meta-coordinates are defined according to the 5′ and 3′ end position along 20 bins on the corresponding transcript. The shade of a square represents the total sum (log10(count)) of ends mapped to the indicated meta-coordinate. The scale is shown on the top right. The total distribution for each meta-coordinate is summarized independently (5′, top; 3′, right). Mol., molecules. (C) Visualization of coverage and alignment of sequenced molecules to Ferritin Light Chain gene from FTL-201 (ENST00000331825) transcript. Genomic coordinates and gene model (orange) with numbered introns are shown on top. Arrowhead and arrow show molecules with retained intron 3, and introns 2 and 3, respectively. Only molecules with 3′ adapter are visualized. Mb, megabase. (D) Distance of 3′ ends of RNAs identified by TERA3 (representative library, blue line), and control (grey), to APA sites. Control was created by generating 100 000 random positions within transcripts detected in at least one library. Only positions with a direct overlap or downstream to Alternative Polyadenylation (APA) sites were considered. Y-axis represents the cumulative percentage of overlaps within the visualized range section. nt, nucleotides.

