Figure 4.
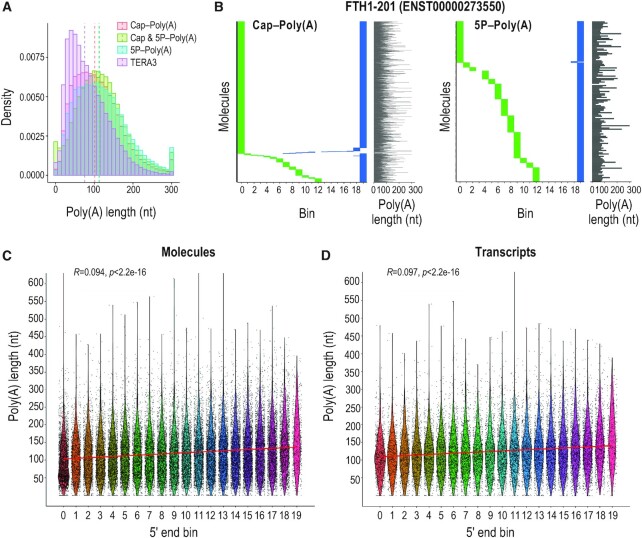
Poly(A) tail characterization with TERA-Seq and its relation to 5′ end decay. (A) Histogram of poly(A) tail lengths from indicated 5TERA libraries and a representative TERA3 library; dashed lines, median values of adapter-ligated molecules. Lengths are binned by 10 nucleotides. Tails longer than 300 nucleotides are merged to the 300 nt bin. (B) Distribution of 5′ (green) and 3′ (blue) ends of Ferritin Heavy Chain 1 transcript (FTH1-201) RNA molecules from indicated 5TERA libraries. Meta-coordinates are defined by splitting each transcript into 20 equal bins. Each horizontal line represents single RNA molecule aligned to FTH1-201. Poly(A) tail length of each molecule (grey line) is shown on the right. Tails longer than 300 nucleotides (nt) are capped to 300 nt. (C, D) Relation between 5′ end meta-coordinates and poly(A) tail length of all molecules (C) and transcripts (D) from 5P-Poly(A) library. Meta-coordinates are defined by splitting each transcript into 20 equal bins. Each point represents a single RNA molecule (C) or transcript (D). Only molecules with 5′ adapter are visualized. Kendall's Tau correlation value, associated p-value, and linear regression (red) are also shown. Poly(A) tail length was capped at 600 nucleotides (nt).

