Figure 5.
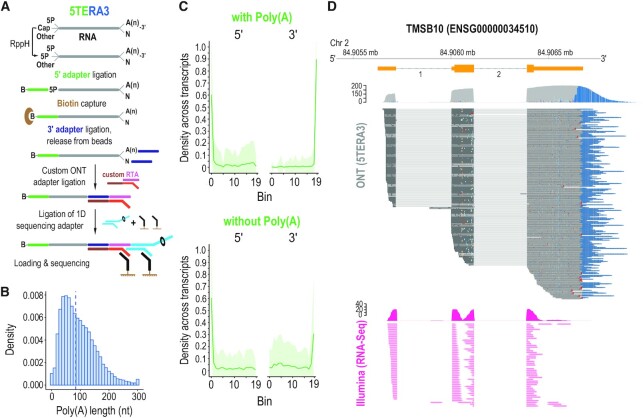
True, end-to-end sequencing of single, native RNA processing and decay intermediates with concurrent 5′ and 3′ adapter ligation (5TERA3). (A) Method schematic. 5P, 5′ monophosphate; A(n), poly(A) tail; B, biotin. Ligated molecules are enriched on streptavidin beads. (B) Histogram of poly(A) tail lengths; dashed line, median value of adapter-ligated molecules from 5TERA3. Lengths are binned by 10 nucleotides (nt). Tails longer than 300 nucleotides are merged to the 300 nt bin. (C) Average read density distribution of molecule ends across re-annotated HeLa transcripts in 5TERA3. Meta-coordinates are defined by splitting each transcript into 20 equal bins. Only top 30% expressed transcripts are shown. Shaded area (green) represents the standard deviation. (D) Visualization of coverage and alignment of sequenced molecules to Thymosin Beta 10 gene from TMSB10-201 (ENST00000233143) transcript with 5TERA3 (top; dark grey); poly(A) tails shown in blue. Non-polyadenylated molecules are shown with red arrowheads. Illumina (short-read; data obtained from (41,42)) coverage and read alignment (fuchsia) are shown on bottom. Genomic coordinates and Ensemble exons (orange) with numbered introns are shown on top. Mb, megabase.

