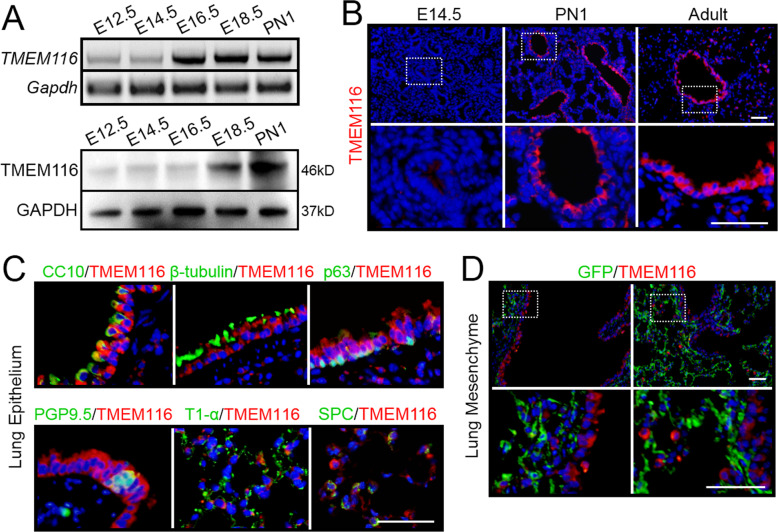
Fig. 1. The expression pattern of TMEM116 in mouse lung.
A The expression level of TMEM116 in mouse embryonic lungs were examined by RT-PCR and western blot analyses. B Immuno-fluorescence (IF) staining analysis showed TMEM116 expression in E14.5, PN1 and adult mouse lungs. C Double IF staining analysis of TMEM116 and p63, β-tubulin, CC10, PGP9.5, T1-α, and Spc respectively. D IF staining analysis of TMEM116 and GFP in Dermo1-cre; ROSAmTmG mice. Representative images from three independent experiments are shown above. Scale bar: 50 μm.

