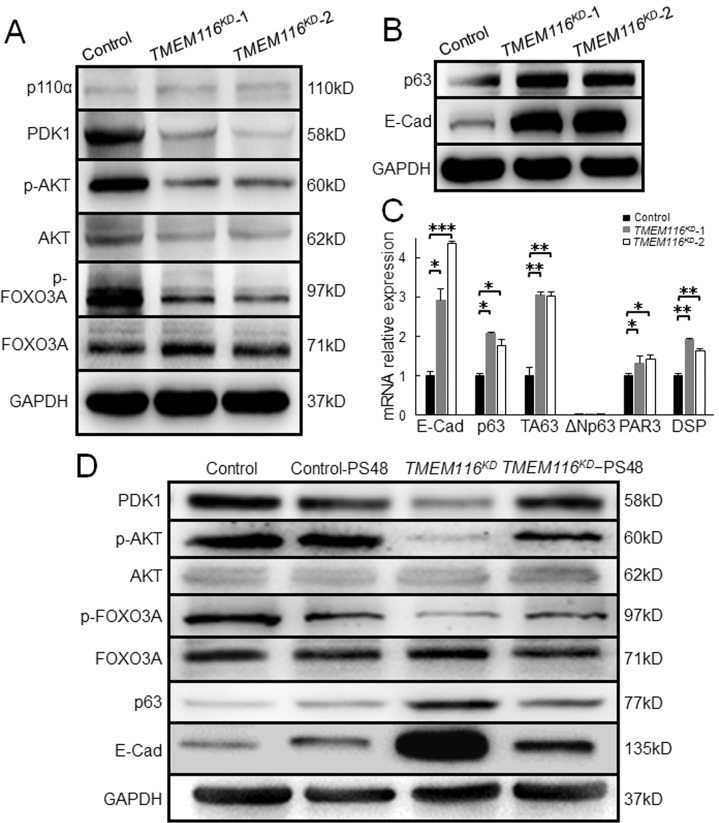
Fig. 5. Effects of TMEM116 on cell migration/invasion is through PDK1/AKT/FOXO3A/TAp63 signaling pathway.
A Western blot analysis of p110α, PDK1, p-AKT, AKT, p-FOXO3A, FOXO3A in control and TMEM116KD A549 cells. B TMEM116KD and control cells expressing p63 and E-cadherin were subjected to western blot analyses. C Real-time PCR analysis of E-Cad, p63, TAp63, ΔNp63, DSP and PAR3 in control and TMEM116KD cells. D TMEM116KD, TMEM116KD-PS48, control-PS48 and control cells expressing PDK1, p-AKT, AKT, p-FOXO3A, FOXO3A, p63, E-Cad were subjected to western blot analyses. Data represent the mean ± SD. *P < 0.05, **P < 0.01, ***P < 0.001. Representative images from three independent experiments are shown above.

