Figure 5.
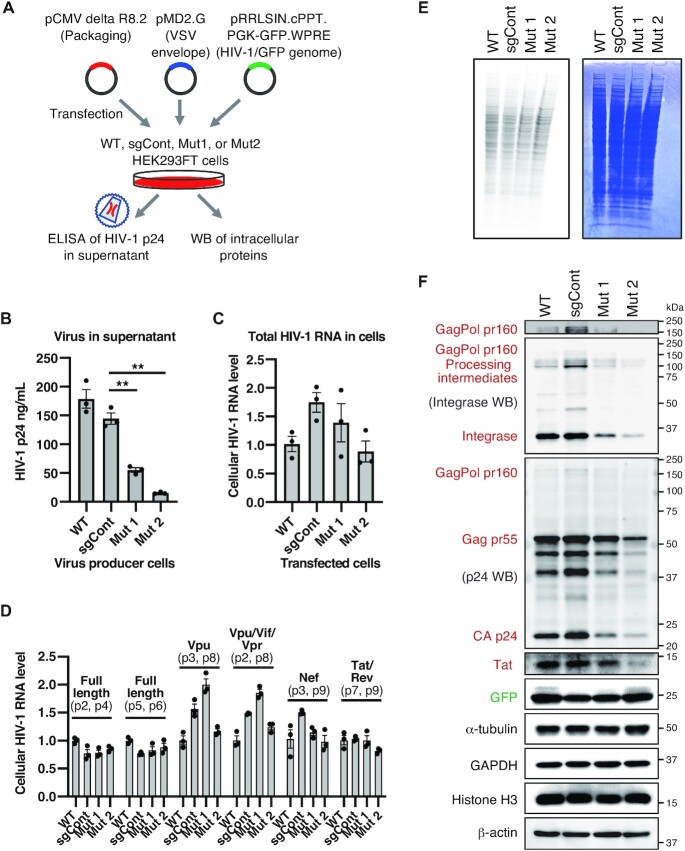
Requirement of TRMT6 for efficient HIV-1 protein accumulation and virus production. (A) Outline of VSV-G pseudotyped HIV-1 production experiment. (B) Quantification of produced HIV-1 particles. HIV-1 particle capsid p24 protein in the cell culture supernatant was analyzed by ELISA to quantify the HIV-1 particles. Means ± s.e.m from n = 3 biological replicates, **P < 0.01 by Welch's t-test. (C) qRT-PCR quantification of total HIV-1 RNA in HEK293FT cells after transfection of HEK293FT cells with pCMV delta R8.2 plasmid. Primers 1 and 10 in Supplementary Figure S3 were used. RNA levels were normalized by GAPDH mRNA levels. Means ± s.e.m from n = 3 independent experiments. (D) qRT-PCR quantification of individual spliced HIV-1 RNA in HEK293FT cells after transfection of pCMV delta R8.2 plasmid. Primer locations (e.g. p2, p3) are depicted in Supplementary Figure S3. Each RNA level was normalized by the total HIV-1 RNA level in Figure 5C. Means ± s.e.m. from n = 3 independent experiments. (E) Nascent cellular protein synthesis observed by pulse-labeling using 35S-methionine that was added to the cell culture media for 1 h. Coomassie brilliant blue (CBB)-stained gel is shown on the right as a loading control and to show the status of steady-state protein levels. (F) Western blot analysis of HIV-1 proteins using HIV-1 integrase antibody, HIV-1 p24 capsid antibody and HIV-1 Tat antibody. Equal amounts of total cellular proteins from the virus producer cells were electrophoresed, and α-tubulin, GAPDH, Histone H3 and β-actin were used as loading controls and cellular proteins whose abundance remained unchanged in TRMT6 mutant cells. Western blotting of integrase or p24 proteins also detected their precursor Gag, GagPol and processing intermediates. HIV-1 proteins expressed from pCMV delta R8.2 plasmid are indicated in red and GFP expressed from pRRLSIN.cPPT.PGK-GFP.WPRE plasmid is indicated in green. The molecular mass marker (kDa) is shown on the right. The top panel is the same image of the region corresponding to the GagPol bands of the second panel, with its contrast changed to visualize GagPol bands. HIV-1 genome and precursor protein structures are shown in Supplementary Figure S3. Independent experiments were performed (n = 3: Tat, Integrase, GFP, α-Tubulin, GAPDH, Histone H3 and β-actin; n = 4: p24, Gag and GagPol). Quantified values are provided in Supplementary Figure S4.

