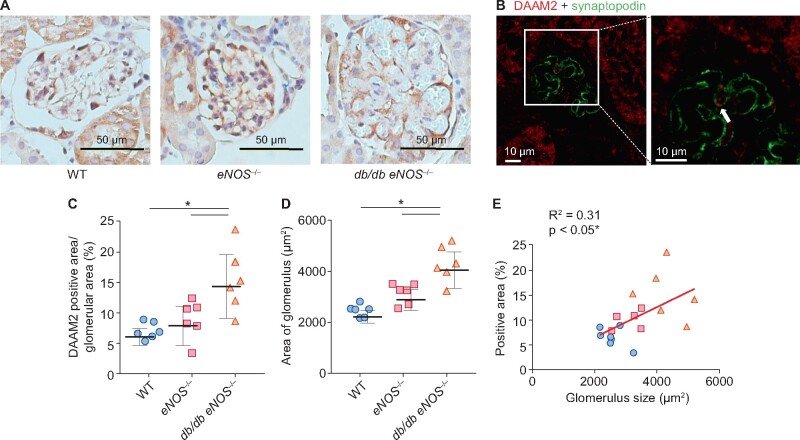
FIGURE 2.
Increased podocyte DAAM2 expression in a DN mouse model. (A–C) Compared with WT and eNOS−/−, podocyte DAAM2 expression was increased in db/db eNOS−/− (DN) mice. (D) Glomerular size increased in DN versus WT and eNOS−/−. (E) Podocyte DAAM2 expression correlated with glomerular size. * means p < 0.05.

