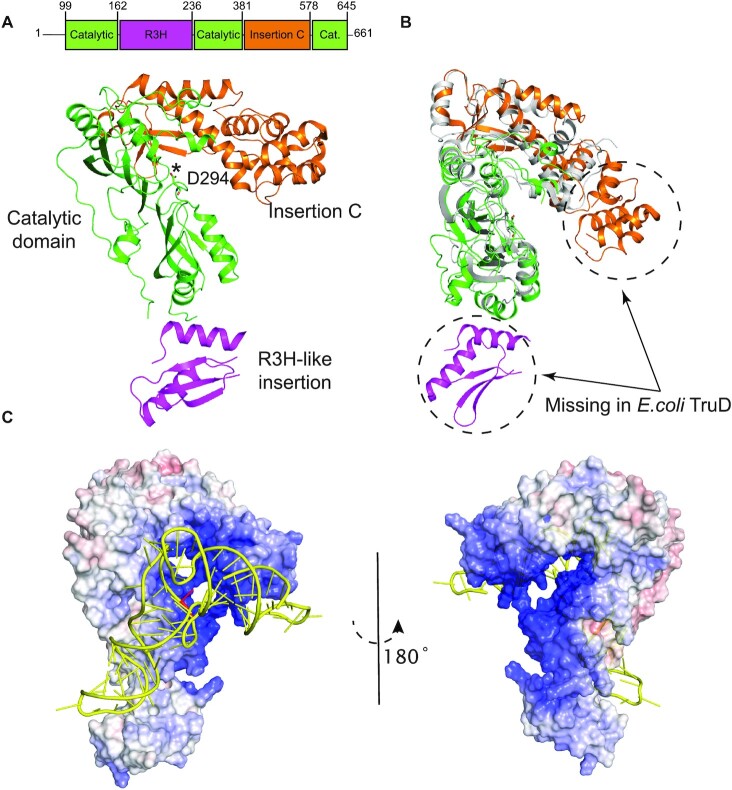
Figure 1.
Overall structure of human PUS7. (A) Crystal structure of PUS7(Δ1−98) is shown in cartoon representation and color-coded according to its domain architecture as labeled. The catalytic D294 residue is shown in sticks and marked with an asterisk. (B) Overlay of PUS7(Δ1−98), color-coded same as (A), and Escherichia coli TruD (gray) (PDB: 1SB7). (C) Overall best-scored predicted model of PUS7-tRNAGln complex. Electrostatic surface potential representation of PUS7(Δ1−98) shown in similar orientation as (A), docked with tRNAGln (yellow). The target U13 in tRNAGln is highlighted in red. PUS7 surface color indicates electrostatic potential ranging from − 10 kT/e (red) to + 10 kT/e (blue). Electrostatic surface potentials were calculated in APBS (36).

