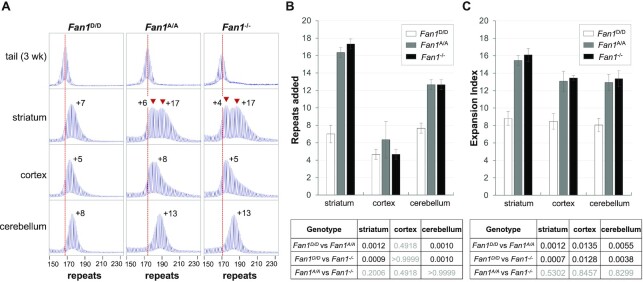
Figure 2.
Comparison of the effect of the D963A and null mutations on the extent of repeat expansion in different brain regions of FXD mice. (A) Typical repeat PCR profiles from the tail taken at 3 weeks of age and different brain regions of 6-month old Fan1D/D, Fan1A/A and Fan1-/- mice matched for initial repeat number. The dotted line represents the size of the original inherited allele as ascertained from the tail DNA taken at weaning. The peaks associated with the two different expansion classes are indicated by the arrowheads. The numbers associated with the tissue samples indicates the number of repeats added during the lifetime of the mouse. (B) Comparison of the number of repeats added in different brain regions of 6-month old Fan1D/D, Fan1A/A and Fan1-/- mice with 168–174 repeats in the original allele. (C) Comparison of the Expansion Index of different brain regions of the mice shown in panel B. In both panels the data represent the average of data from 3 animals of each genotype. The error bars indicate the standard deviations of the mean. Significance was assessed using a RM two-way ANOVA (genotype and tissue as variables) with correction for multiple testing as described in the Materials and Methods. The adjusted P values of genotype effect are listed in the table below.

