
Figure 8 .
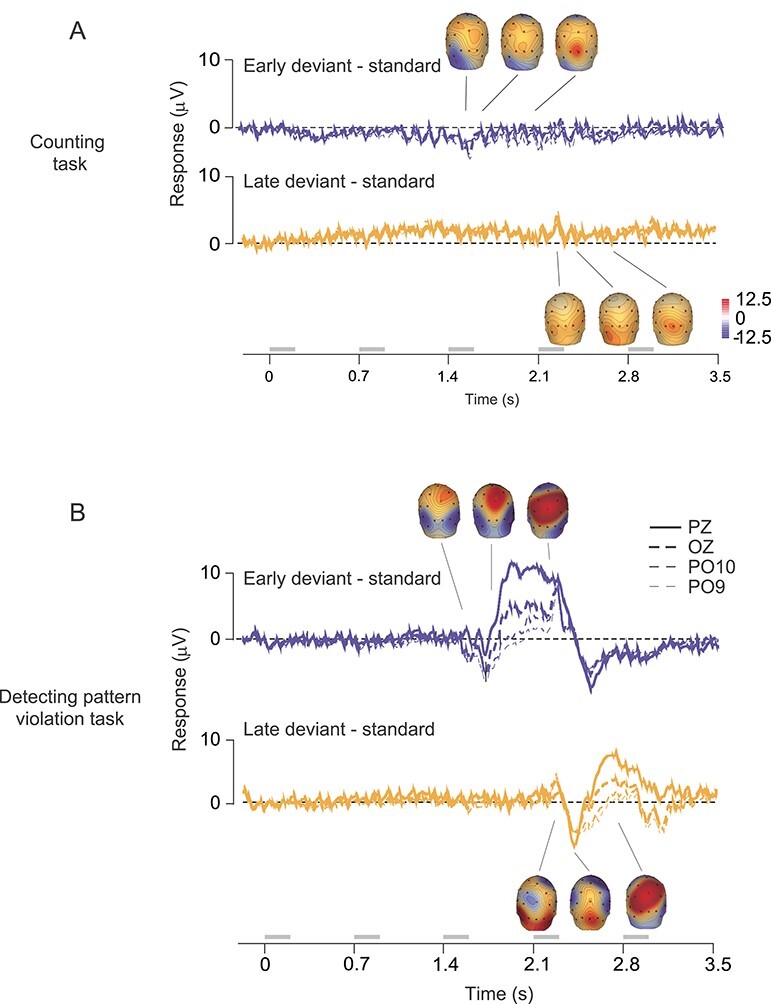
Scalp current source density analysis of human EEG responses. (A) Difference between average EEG response to the early deviant and standard (top, blue), and late deviant and standard (bottom, yellow), for responses recorded during the counting task. Time axis markers indicate onset of each stimulus in the sequence. Responses from four electrodes are shown. Insets show scalp topography of current source density analysis of the difference waveforms. Topography is calculated at times of 1577, 1682, and 2043 ms (from left to right) for the top trace; and for 2235, 2379, and 2673 ms for the bottom. (B) Difference traces for the active task. Responses from 5 electrodes are shown. Topography is calculated at times of 1556, 1688, and 2052 ms (from left to right) for the top trace; and for 2235, 2379, and 2673 ms for the bottom. Gray bars indicate epochs during which stimuli were presented.