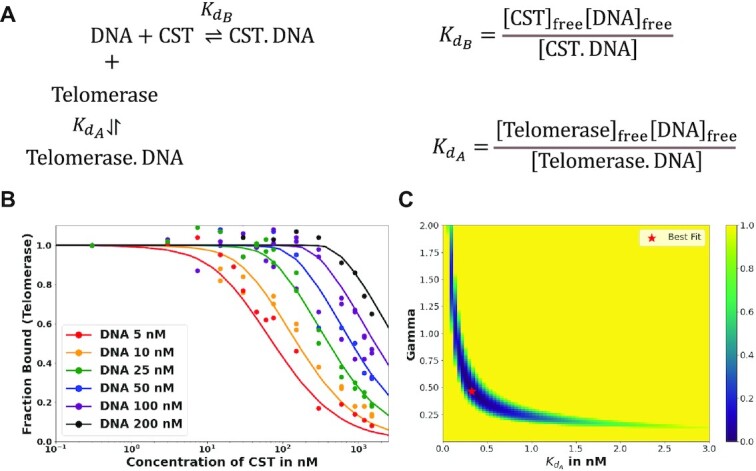
Figure 4.

Fitting telomerase inhibition data. (A) Schema of competitive binding mechanism and relevant equilibrium equations. (B) Best fit telomerase inhibition curves. Telomerase inhibition assay data (points) were corrected by a factor of 3 relative to those in Supplementary Figure S2, as described in Materials and Methods. The predicted fraction bound curves were generated with optimized  and γ values of 0.324 nM and 0.465, respectively. Inhibition by WT CST. (C) Heat map of error values. Error values (residual Sum of squares, see Materials and Methods) as a function of γ and Kd telomerase–DNA pairs with pair of best fit indicated. Value of error colored per bar on right.
