FIGURE 1.
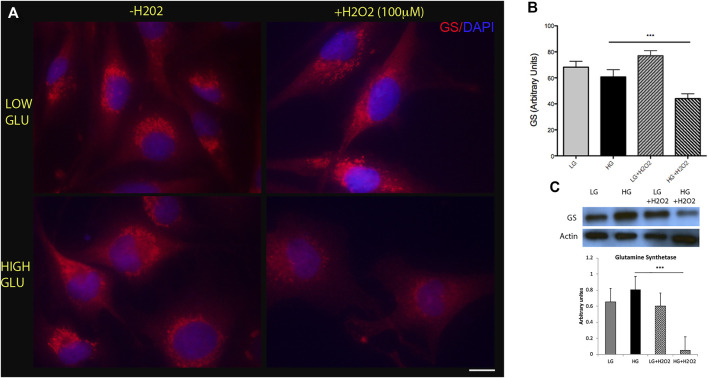
High glucose and oxidative stress induce a decrease in glutamine synthetase (GS) levels. (A) Representative immunofluorescence showing GS levels (red) in MGs cultured under low glucose (LG, 5 mM) or high glucose (HG, 25 mM) concentrations with (+H2O2, 100 μM) or without (−H2O2). DAPI was used for nuclei staining. Scale bar: 10 μm. (B) Quantification was performed using the ImageJ program and differences were analyzed using the GraphPad Prism 5 software (One-way ANOVA followed by Bonferroni’s multiple comparison test). (C) Representative Western blot of GS levels. β-actin was used for normalization. Quantification of bands was performed using the ImageJ program. Images show a representative picture from three independent experiments. Data are mean ± SE, ***p < 0.001.

