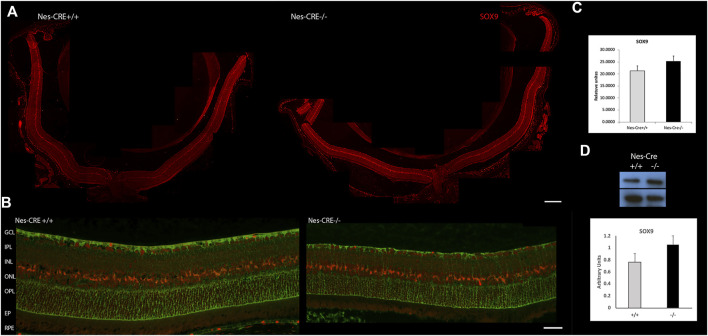
FIGURE 5.
SOX9 levels in retinas from mice with a conditional deletion of SIRT6 from the CNS. (A) Representative immunofluorescence of SOX9 levels (red) in Nes-Cre+/+ (left panel, n = 4) and Nes-Cre−/− (right panel, n = 5) whole retinal sections. Scale bar: 100 μm. (B) Higher magnification photos show colocalization of SOX9 with glutamine synthetase (green) in Müller cells and RPE. Scale bar, 50 μm Ganglion Cell Layer (GCL), Inner Plexiform Layer (IPL), Inner nuclear Layer (INL), Outer Plexiform Layer (OPL), Outer Nuclear Layer (ONL), Retinal Pigment Epithelium (RPE). (C) Fluorescence intensity was quantified using the ImageJ program. (D) Representative Western blot of SOX9 levels from retinal extracts of Nes-Cre animals. β-actin was used for normalization. Quantification of bands was performed using the ImageJ program. Data are mean ± SE.

