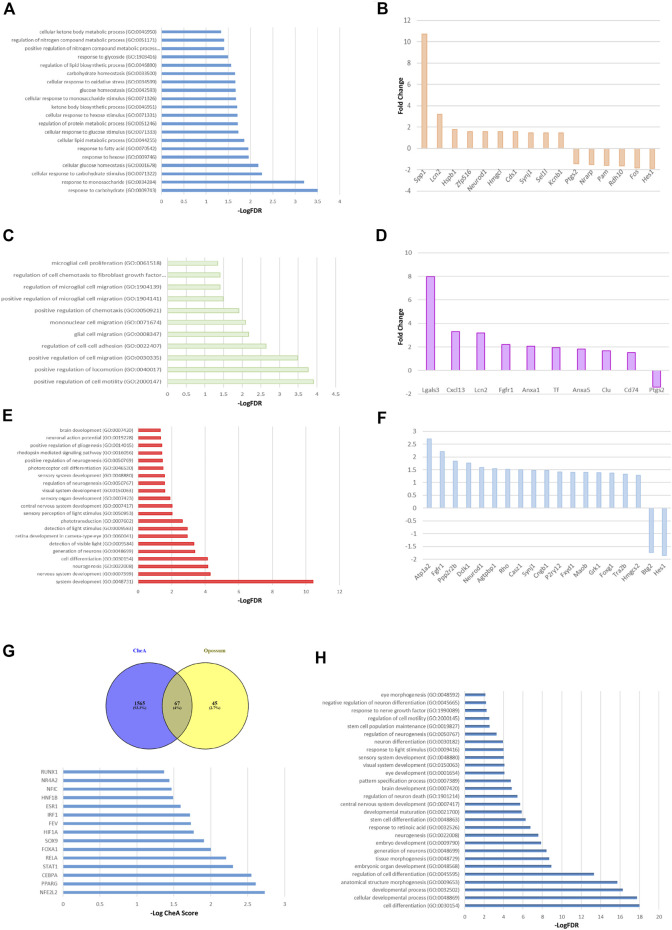
FIGURE 6.
Transcriptomic analysis of Müller glial cells from a murine model of Diabetes. GO enrichment analysis of the 163 altered mRNAs shows the GO terms associated with metabolic processes (A), migration and motility pathways (C) and cellular differentiation processes (E), specially focused on neurogenesis, brain and visual sensory organs development. The top ten of upregulated and downregulated genes associated with the metabolic processes, glial cells migration and cell reprogramming are described in panels (B, D, F) respectively. (G) The top panel shows the transcription factors that could explain the changes in diabetic MGs gene expression shared between ChEA and Opossum enrichment analysis. Lower panel depicts the top 15 transcription factors, in terms of ChEA score, that explain the transcriptome of diabetic MGs. (H) GO analysis using the 67 predicted transcription factors. Only the GO terms associated with development, specially brain and eye development, are shown.

