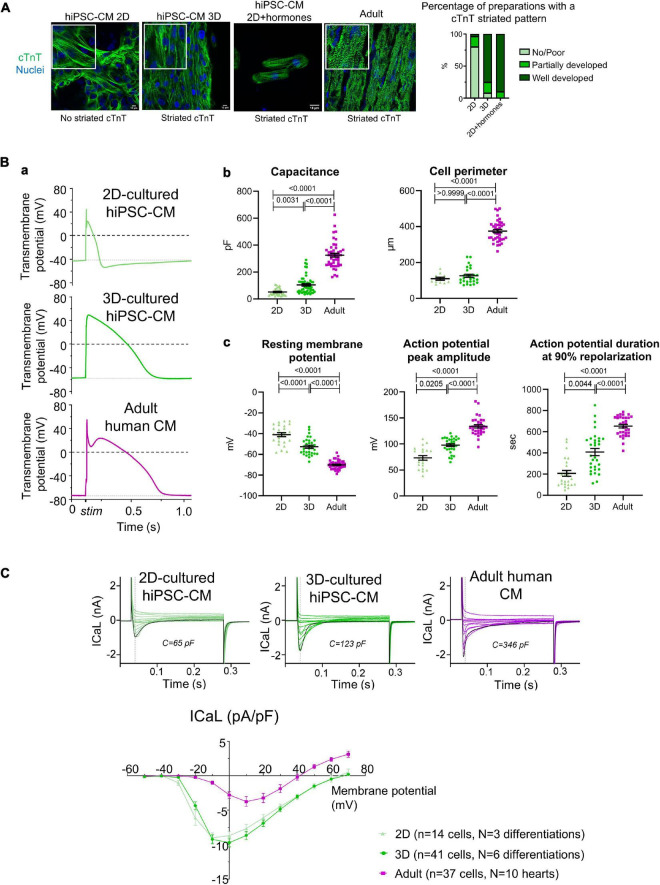
FIGURE 3.
(A) Cardiac troponin T (cTnT) organization in hiPSC-CM. Left: immunostaining for cTnT (green) and nuclei (blue) in hiPSC-CM cultured in 2D, 3D, or 2D+hormones seeded on Matrigel mattresses, and for comparison in adult human cardiac tissue. Right: semi-quantitative analysis of the cTnT striated pattern (2D: n = 25 preparation from five independent differentiations; 3D: n = 24 preparations from six independent differentiations; 2D+hormones: n = 10 preparations from two independent differentiations). (B) (a) Representative example of electrically stimulated action potentials. (b) Analysis of cell capacitance (2D-hiPSC-CM: n = 34 cells; 3D-hiPSC-CM: n = 52 cells; adult cardiomyocytes: n = 46 cells) and cell perimeter (2D-hiPSC-CM: n = 11 cells; 3D-hiPSC-CM: n = 27 cells; adult cardiomyocytes: n = 39 cells). (c) Analysis of resting membrane potential (2D-hiPSC-CM: n = 25 cells; 3D-hiPSC-CM: n = 33 cells; adult cardiomyocytes: n = 43 cells), action potential amplitude (2D-hiPSC-CM: n = 21 cells; 3D-hiPSC-CM: n = 31 cells; adult cardiomyocytes: n = 32 cells), and duration at 90% repolarization (2D-hiPSC-CM: n = 21 cells, N = 3 differentiations; 3D-hiPSC-CM: n = 31 cells, N = 6 differentiations; adult cardiomyocytes: n = 32 cells, N = 10 hearts). (C) Top: representative example of ICaL over membrane potentials spanning from –40 to +70 mV. The black curve represents the voltage step at 0 mV. Bottom: current-voltage curve of the ICaL measured at the peak current (n numbers are indicated in the graph). P-values are indicated above each graph; Kruskal–Wallis with a Dunn’s multiple comparison test was used for all, except for resting membrane potential where a Welch ANOVA test, followed by Dunnett T3 for multiple comparisons, was used.

