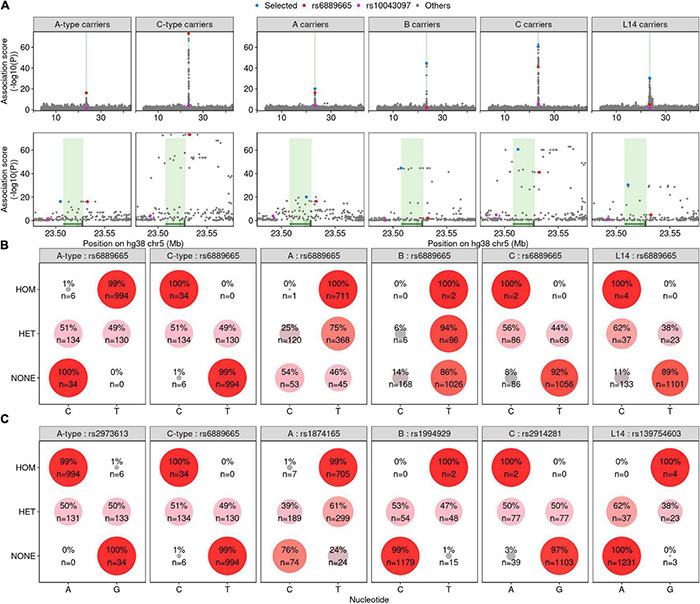
FIGURE 3.

Single-nucleotide polymorphisms (SNPs) are associated with different PRDM9 alleles. (A) Association scores for all SNPs in a ±20-Mb window around the PRDM9 locus (see “Materials and Methods”). The PRDM9 genotype examined is given in the title of each panel (individuals carrying at least one copy of A-type, C-type, A, B, C, or L14 PRDM9 alleles, respectively). SNPs previously shown to be linked to recombination patterns in African populations (Hinch et al., 2011) are marked in red (rs6889665) and pink (rs10043097). Lower panels show a magnified view around the peak in the association signal at PRDM9. The PRDM9 gene is indicated by green shading. (B) Assessment of the prevalence of rs6889665 alleles. Individuals were classified as homozygous (HOM), heterozygous (HET), or non-carriers (NONE) of the PRDM9 allele indicated in gray in the column header. The prevalence of the C and T alleles of rs6889665 were assessed in each group. Larger circle size and deeper red color indicate a higher prevalence. (C) Similar to (B), but for the best-scoring SNP [blue in panel (A)] for each PRDM9 genotype we tested.
