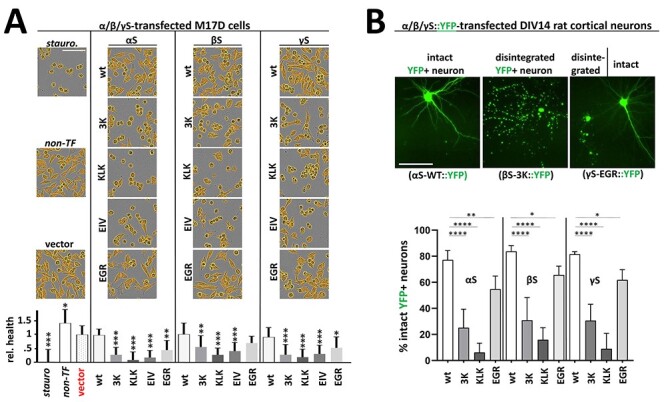
Figure 6 .

(A) Live-cell imaging of M17D cell confluence. M17D cells transfected with FLAG3-tagged wt, 3K, KLK, EIV or EGR variants for all human synuclein homologs. Staurosporine-treated (a strong toxin, positive control, set to 0 viability), non-transfected and vector-transfected cultures (both negative controls) are shown in the left column. Images were taken 48 h post-transfection by IncuCyte live-cell imaging. Cells were identified and their confluence quantified by using a custom IncuCyte algorithm that identifies areas occupied by cells (displayed in orange). Images are representative of N = 4 independent experiments performed in quadruplicates (n = 16). Graph shows mean data and standard deviation. All statistics relative to vector only (red). One-way ANOVA analysis, Tukey’s multiple comparisons test. *P < 0.05; **P < 0.01; ***P < 0.001. Scale bar, 50 µm. (B) Assessing neuron integrity upon transfection of YFP-tagged synuclein variants. YFP-tagged wt, 3K, KLK or EGR variants for all human synuclein homologs were transfected into DIV14 rat cortical neurons. Transfection efficiency <5% allowed for assessing integrity of single transfected neurons 96 h post-transfection. After image acquisition and blinding, cells were categorized into ‘intact’ and ‘disintegrated’ and the relative percentage of intact neurons was calculated (N = 3 independent experiments, n = 2 transfected wells per experiment and variant, 36 fields per well). Graph shows mean data and standard deviation. All statistics relative to the respective wt variant. One-way ANOVA analyses, Tukey’s multiple comparisons test. *P < 0.05; **P < 0.01; ****P < 0.0001. Scale bar, 50 µm.
