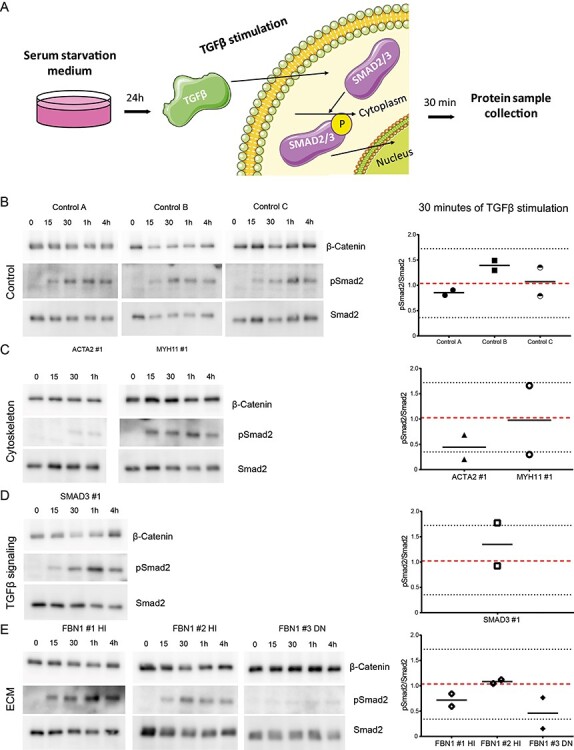
Figure 3 .

TGFβ responsiveness of control and fibroblasts of patients with a pathogenic mutation. (A) Schematic depicting TGFβ stimulation of control and patient fibroblasts. Cells are serum starved for 24 h, upon which they are stimulated with TGFβ, which induces SMAD2 phosphorylation. Samples are harvested for western blot after 30 min. (B) Western blots detecting pSMAD2 and SMAD2 in control fibroblasts before and upon stimulation with TGFβ (15, 30 min, 1 and 4 h) and quantification of the pSMAD2/SMAD2 ratio. (C) Western blots detecting pSMAD2 and SMAD2 in fibroblasts with a mutation in a cytoskeleton encoding gene before and upon stimulation with TGFβ (15, 30 min, 1 and 4 h) and quantification of the pSMAD2/SMAD2 ratio. (D) Western blots detecting pSMAD2 and SMAD2 in fibroblasts with a mutation in a TGFβ signaling pathway encoding gene before and upon stimulation with TGFβ (15, 30 min, 1 and 4 h) and quantification of the pSMAD2/SMAD2 ratio. (E) Western blots detecting pSMAD2 and SMAD2 in fibroblasts with a mutation in an ECM encoding gene before and upon stimulation with TGFβ (15, 30 min, 1 and 4 h) and quantification of the pSMAD2/SMAD2 ratio. β-catenin levels serve as a loading control. Data are presented as boxplots with mean ± 2SD; red dotted line indicates mean value of the control cells, black dotted lines indicate ±2SD.
